
“Europe is definitely not growing and not creating a lot of wealth. Europe is rather using and consuming wealth.” — Sergio Ermotti, CNBC, 6 October 2026.1
There are sentences that sound provocative because they are exaggerated.
And there are sentences that sound provocative because they compress an uncomfortable amount of truth into very few words.
Sergio Ermotti’s remark belongs closer to the second category.
The UBS chief executive was explaining why the United States matters so much to a global wealth manager. Roughly 40 percent of the world’s millionaires live there, he said. UBS sees additional growth in the United States and Asia. Europe, by contrast, is not creating much new wealth.12
Taken literally, “Europe is not growing” is too broad. Europe does grow. Some European economies grow very well. Poland is one of the clearest counterexamples.
But the larger point survives scrutiny.
Europe remains one of the wealthiest places on Earth. It has enormous accumulated private wealth, world-class universities, industrial capabilities, functioning institutions, advanced infrastructure and hundreds of millions of educated people.
Yet over the last two decades, much of Europe has become progressively worse at turning those advantages into productivity, scalable companies, investment, new industries and new wealth.
That is a different kind of decline.
It is not collapse.
It is drift.
And drift can be more dangerous because it rarely produces the moment of crisis that finally forces a system to change.
Europe is not poor. Europe is slow.
The first mistake in this debate is to confuse economic level with economic momentum.
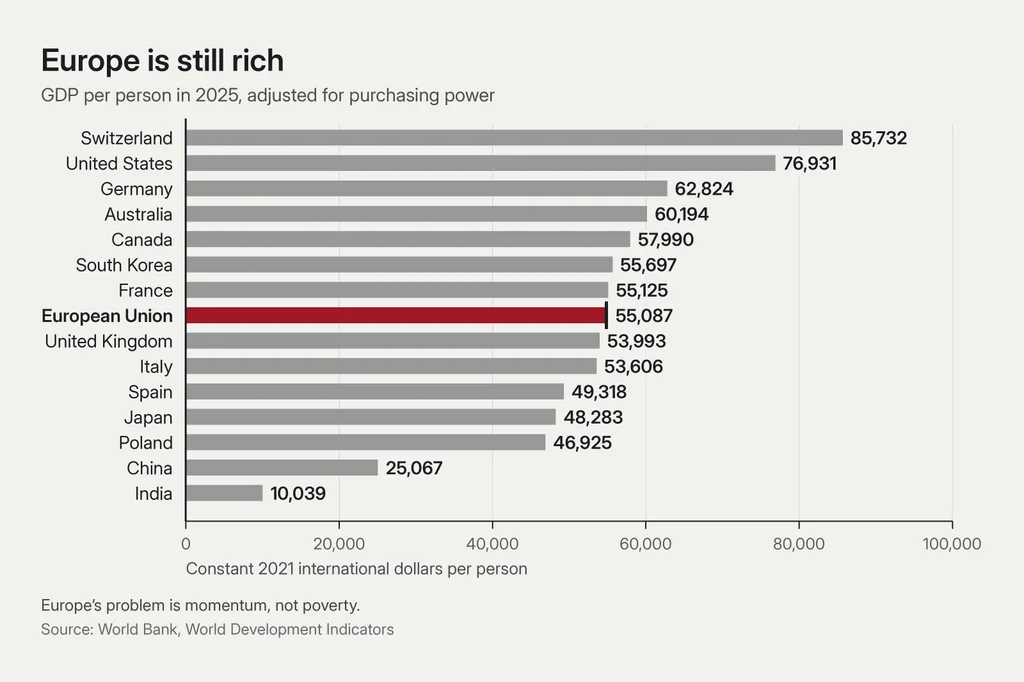
Europe is still rich.
On a purchasing-power-adjusted basis, Switzerland produced roughly $85,700 of GDP per person in 2025. The United States was around $76,900. Germany was around $62,800. France and the EU as a whole were around $55,100. China was roughly $25,100 and India about $10,000.3
So this is not a story about a continent that has suddenly become poor.
It is a story about a rich continent whose relative dynamism has weakened.
The twenty-year record is revealing.
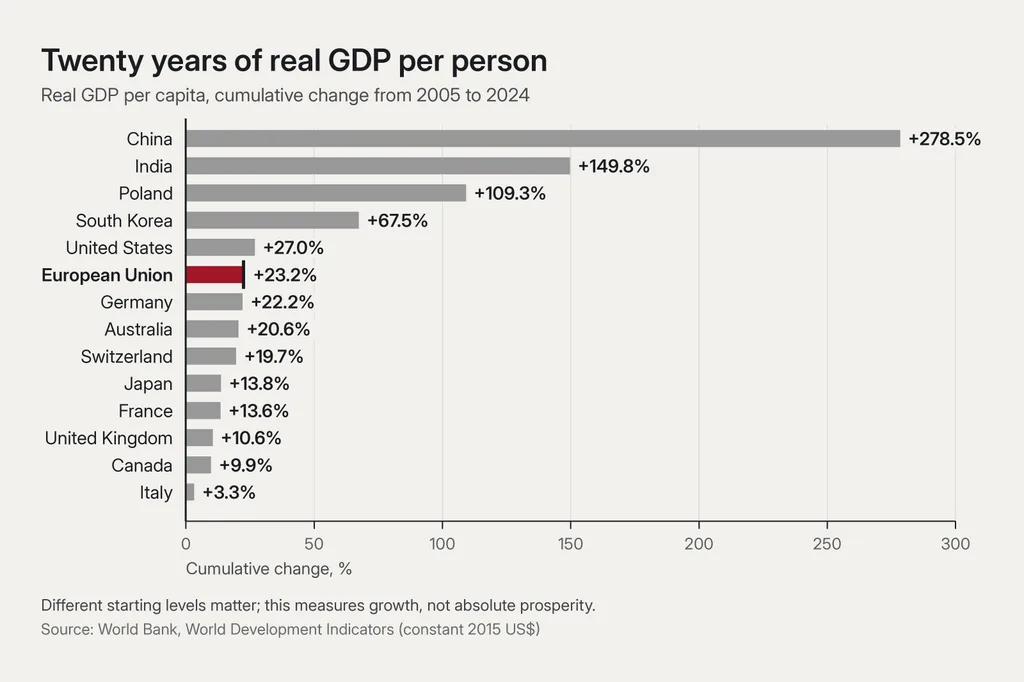
Between 2005 and 2024, real GDP per capita increased by roughly 27 percent in the United States. The European Union managed about 23 percent. Germany grew about 22 percent. Switzerland about 20 percent.
Those figures are disappointing rather than catastrophic.
The real warning appears when the large Western European economies are separated.
France managed roughly 14 percent real GDP-per-capita growth over the period. Britain around 11 percent. Italy barely moved at all: roughly 3 percent in almost twenty years.
Now compare that with Poland, where real GDP per capita more than doubled.
Or South Korea, where it rose by roughly two thirds.
Or India, where it increased by roughly 150 percent.
Or China, where it almost quadrupled.4
Those countries started from different levels. Catch-up growth matters. No serious comparison should pretend otherwise.
But catch-up does not explain why some mature economies continue to compound productivity and investment better than others.
Nor does it explain Italy essentially losing an economic generation.
The better question is not:
Why can Europe not grow?
It clearly can.
The better question is:
Why have so many of Europe’s richest and most institutionally capable economies become so bad at generating growth?
Ermotti’s timing matters
This is not only a backward-looking problem.
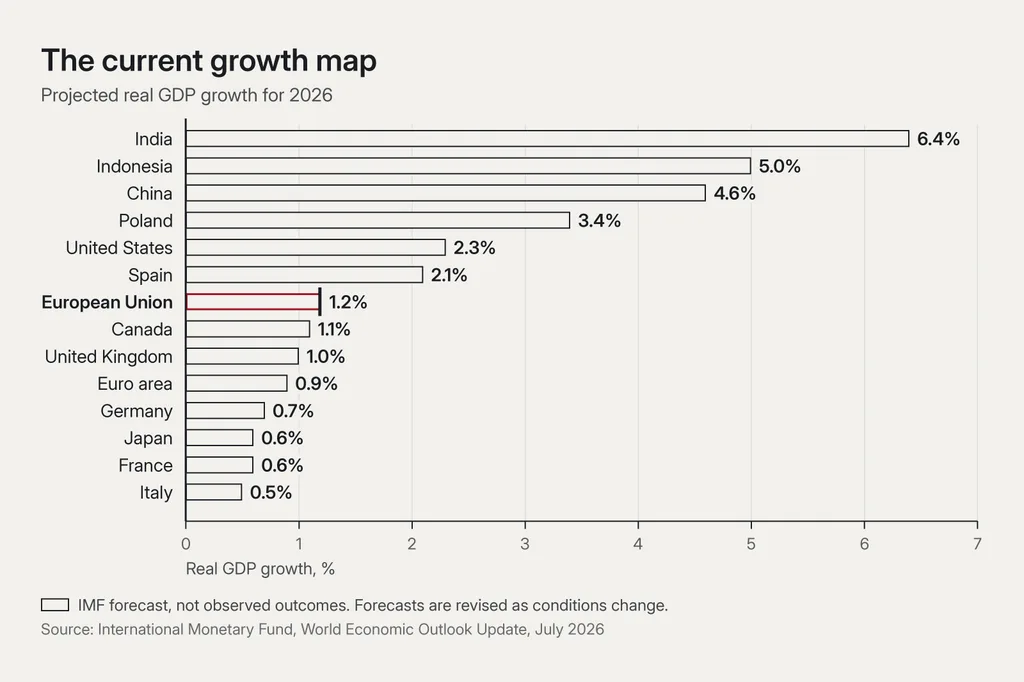
The IMF’s July 2026 outlook expects real GDP growth of about 2.3 percent in the United States, 4.6 percent in China and 6.4 percent in India.
The euro area is forecast at about 0.9 percent.
Germany: 0.7 percent.
France: 0.6 percent.
Italy: 0.5 percent.5
Poland and Spain again complicate the simple “Europe does not grow” narrative. They are expected to perform materially better.
That is important.
Europe is not one economy and policy still matters.
But for a bank such as UBS, Ermotti’s conclusion is rational.
A wealth manager does not merely ask where wealth already exists.
It asks where tomorrow’s wealth is likely to be created.
That is why the United States matters.
That is why Asia matters.
And that is why the European problem is larger than a few weak GDP prints.
The real warning is productivity
Growth can come from population.
Growth can come from people working more hours.
Growth can come from fiscal expansion.
But sustainable increases in living standards ultimately depend heavily on productivity: producing more value from the same amount of labour and capital.
This is where Europe’s position becomes much harder to dismiss.
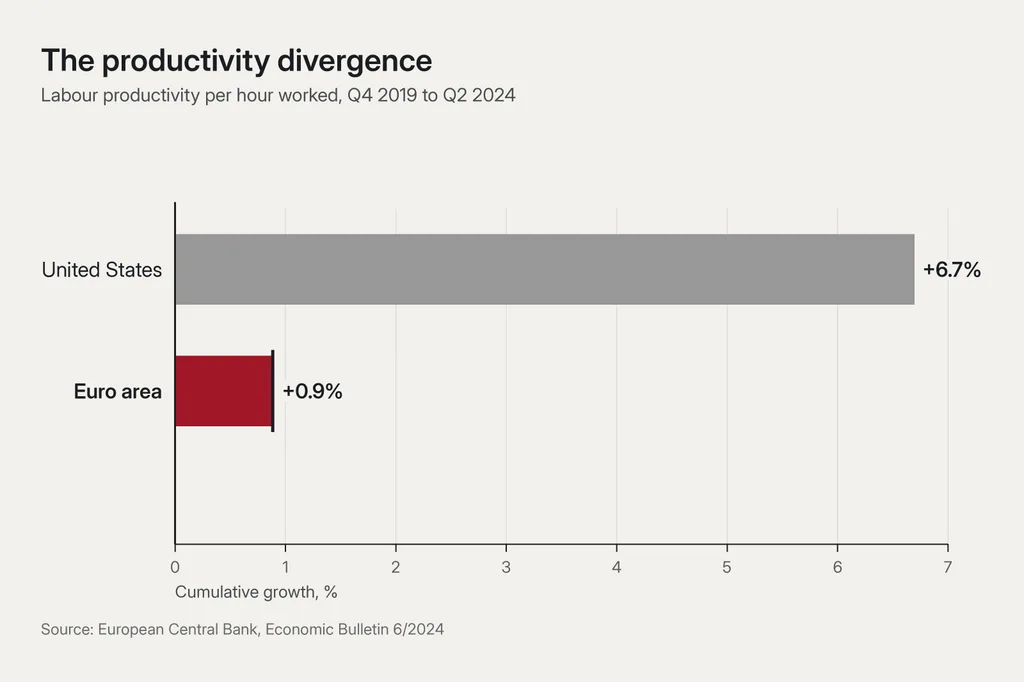
Between the fourth quarter of 2019 and the second quarter of 2024, labour productivity per hour worked increased by only 0.9 percent in the euro area.
In the United States it increased by 6.7 percent.6
The longer-term numbers point in the same direction.
The OECD reports that US labour productivity grew another 2.2 percent in 2024. EU productivity rose only 0.2 percent after falling 0.9 percent the previous year.
Measured in constant purchasing-power terms, average EU labour productivity in 2024 stood at only around three quarters of the US level.7
That is not an accounting curiosity.
Productivity eventually appears everywhere:
in wages,
in corporate margins,
in tax revenues,
in the affordability of pensions,
in defence budgets,
in the ability to finance healthcare,
and in the amount of political room a society has to solve new problems.
A country can redistribute wealth.
It cannot redistribute productivity that does not exist.
The investment machine is malfunctioning
Europe does not lack savings.
It lacks an equally effective mechanism for turning savings into productive risk.
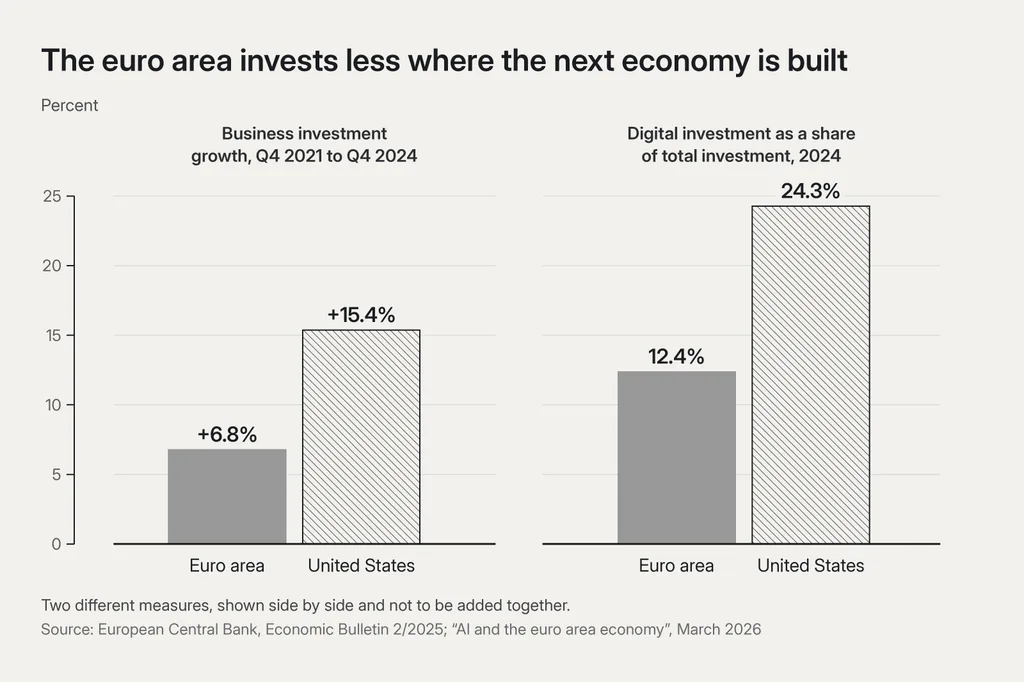
Between the fourth quarter of 2021 and the fourth quarter of 2024, business investment increased by about 15.4 percent in the United States.
The euro area managed 6.8 percent.8
The gap becomes even more striking when investment moves closer to the technologies likely to define the next economic cycle.
Digital investment represented about 12.4 percent of total investment in the euro area in 2024.
In the United States it represented 24.3 percent.
By 2025, the ECB estimated the gap had widened again: about 13 percent versus 27.3 percent.9
This is happening as artificial intelligence moves from software feature to economic infrastructure.
Data centres.
Compute.
Power generation.
Grid capacity.
Networking.
Chips.
Robotics.
Automation.
AI-native business processes.
If the productivity gains of the next decade are concentrated in these systems, Europe is beginning the race while investing at a structurally lower intensity.
That is not a prediction of failure.
It is a measurable disadvantage.
Then there is venture capital
The European Central Bank estimates that VC funds located in the United States have total fund size of roughly €930 billion.
EU-located funds: roughly €150 billion.
Approximately six to one.10
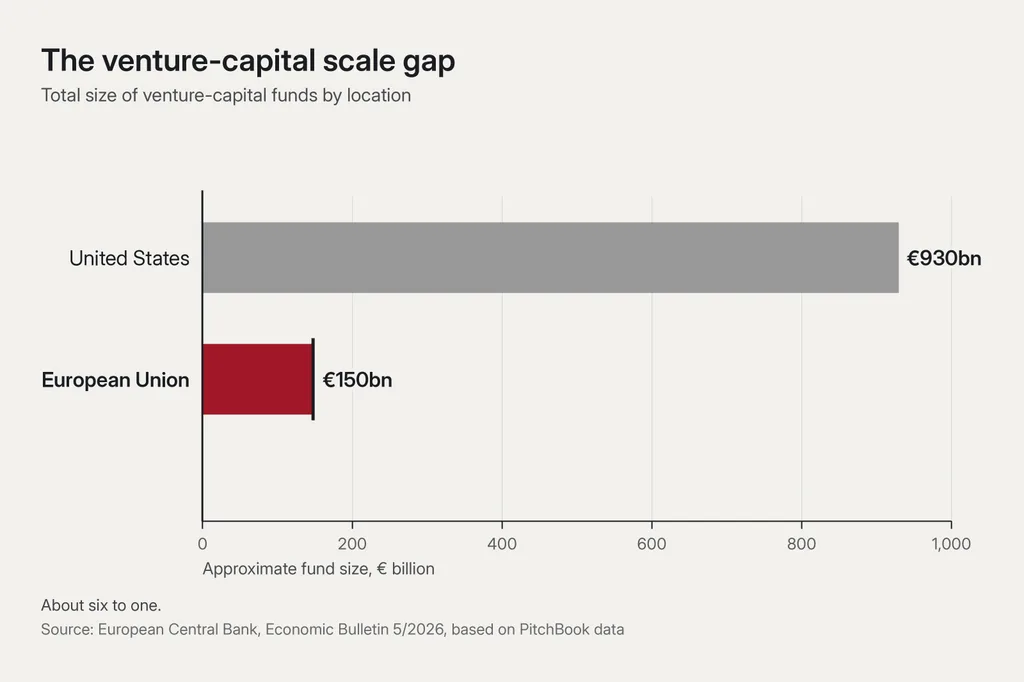
This is one of the clearest examples of Europe’s problem.
European universities produce research.
European engineers build excellent technology.
European founders create companies.
European households save substantial amounts of money.
Then, too often, the financing required to scale those companies appears elsewhere.
The ECB identifies gaps in later-stage financing, a narrower institutional investor base and fragmented cross-border capital markets as important causes.10
Europe therefore manages to perform an extraordinary economic trick:
it produces talent and savings and still allows a disproportionate share of the compounding to happen somewhere else.
European companies themselves tell us what is happening
The European Investment Bank surveys roughly 13,000 firms across the EU, with a US comparison sample.
Its 2024 survey found that only 26 percent of EU firms expected to expand capacity over the next three years.
In the United States, the figure was 47 percent.11
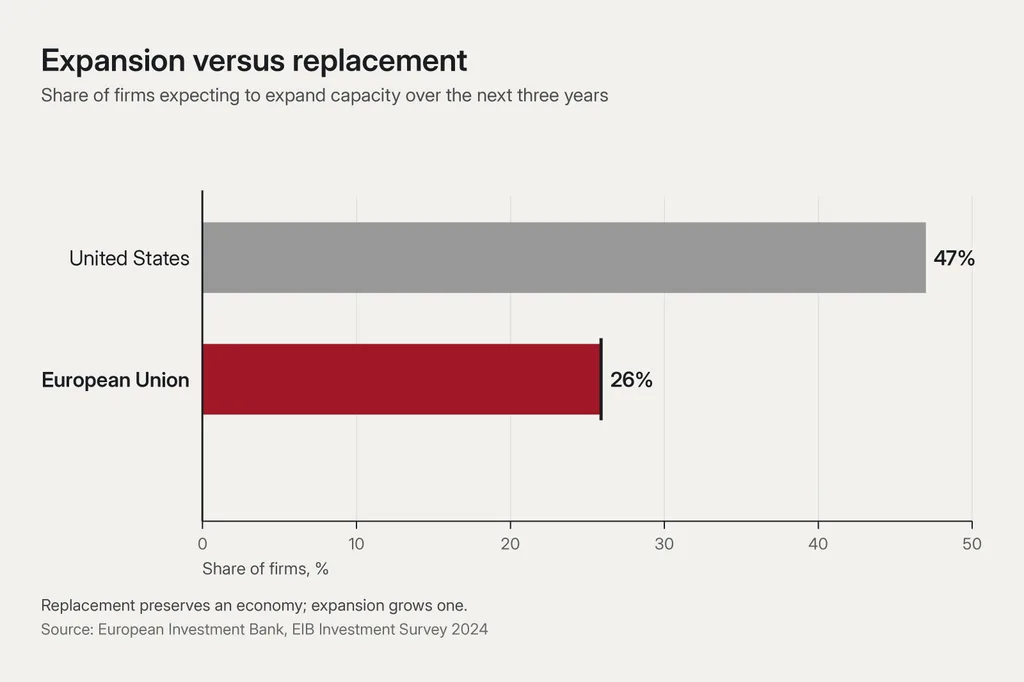
That difference deserves more attention than it receives.
Replacement investment preserves an economy.
Expansion investment grows one.
One keeps yesterday’s factory operating.
The other builds the next factory.
One protects capacity.
The other creates capacity.
It is difficult to build a dynamic continent if companies increasingly optimise for replacement rather than expansion.
Energy turned a structural problem into an industrial one
Europe’s industrial energy disadvantage is no longer marginal.
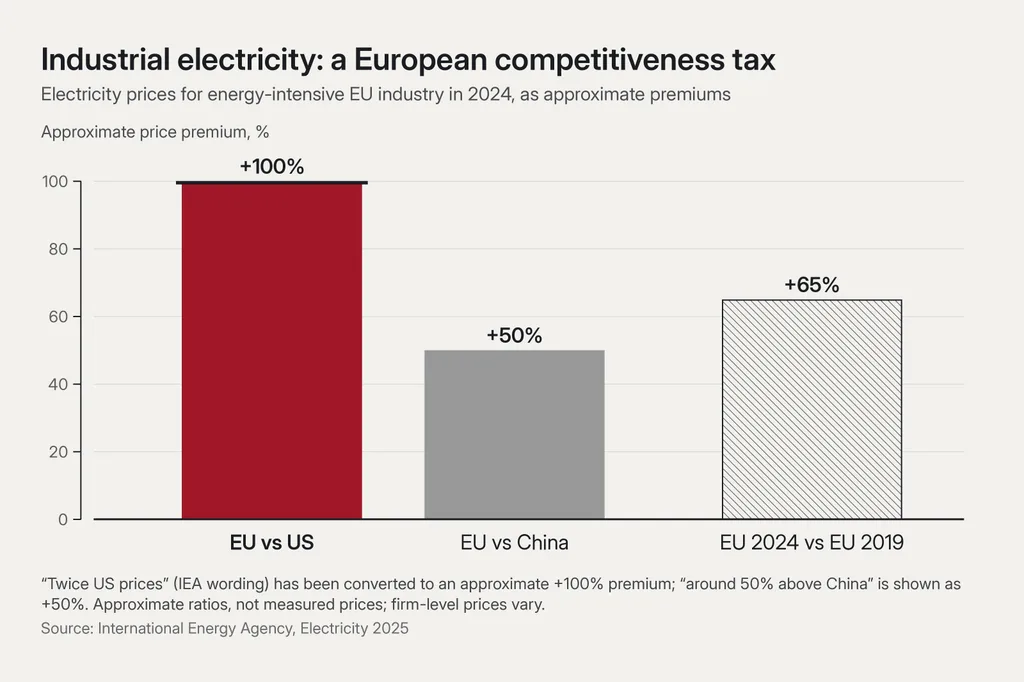
The International Energy Agency estimates that electricity prices for energy-intensive EU industries in 2024 remained roughly twice US levels and around 50 percent above China.
They were still around 65 percent higher than in 2019.12
For software companies this matters indirectly.
For chemicals, metals, glass, advanced manufacturing, batteries, data centres and large-scale industrial processes, it can determine whether an investment makes economic sense at all.
The EIB found that 46 percent of EU firms considered energy costs a major obstacle to investment.11
Europe therefore faces an unpleasant combination:
slower investment,
higher energy costs,
weaker productivity growth,
and an increasingly urgent need to spend more on defence, infrastructure, ageing and the energy transition.
The demographic arithmetic is becoming brutal
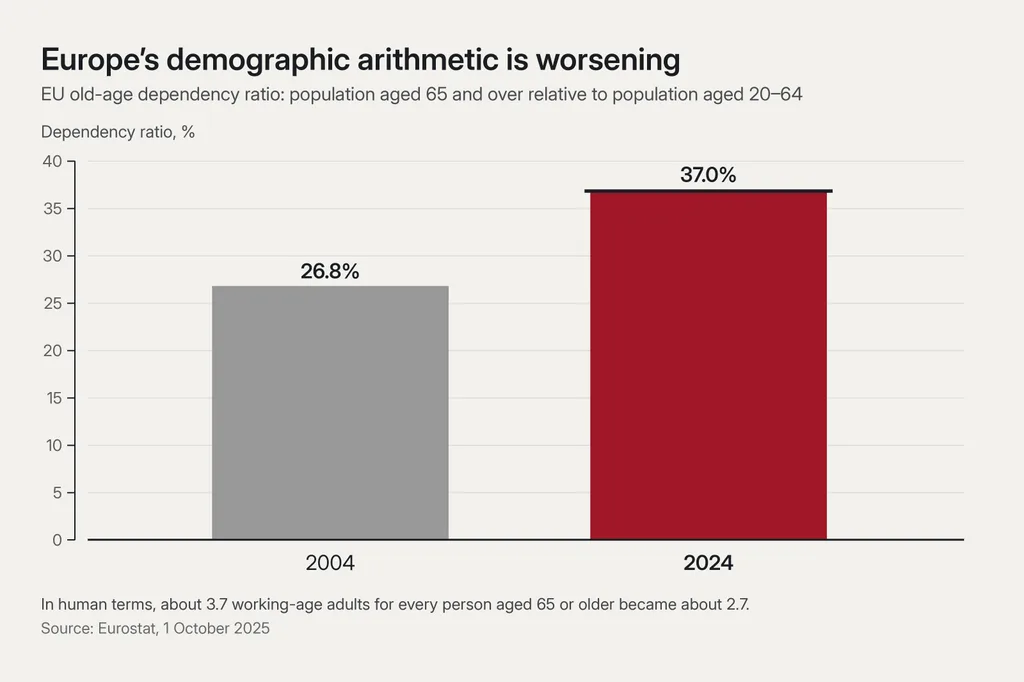
The EU old-age dependency ratio increased from 26.8 percent in 2004 to 37.0 percent in 2024.
Translated into ordinary language, Europe went from roughly 3.7 working-age adults for every person aged 65 or older to about 2.7.13
This is not an argument against old people.
It is arithmetic.
Pensions and healthcare are financed by some combination of current workers, accumulated capital and public borrowing.
When the number of retirees rises relative to the working-age population, each of those mechanisms comes under more pressure.
That makes productivity growth more important, not less.
Yet Europe is ageing at the same time as its productivity performance disappoints.
This is where the generational argument becomes real — but must remain precise
There is a legitimate generational dimension to this problem.
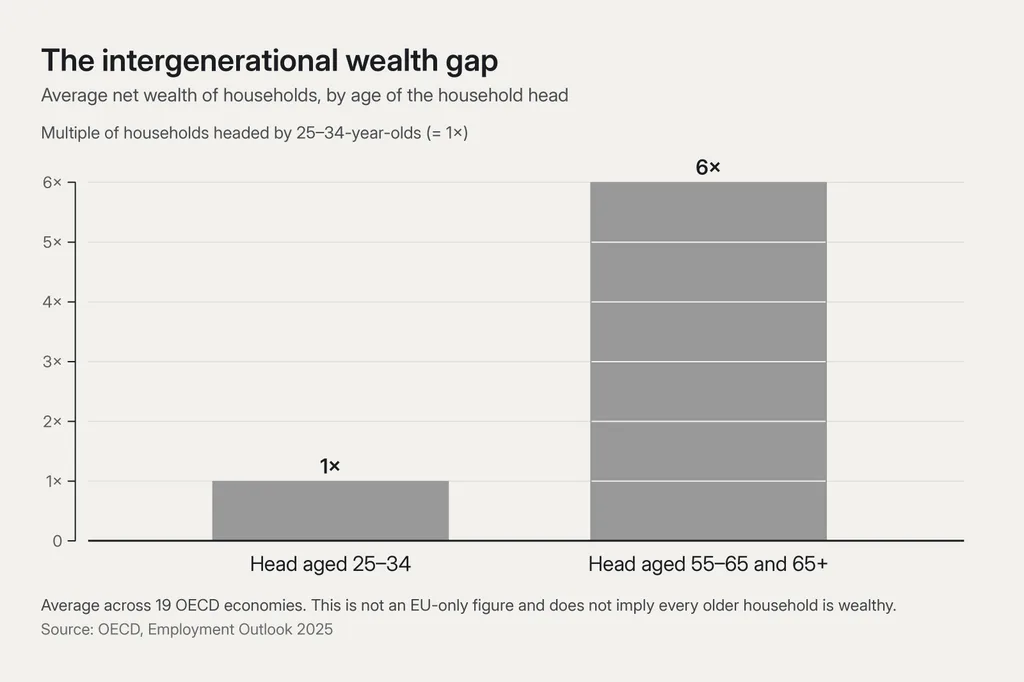
Across 19 OECD economies, households headed by people aged 55–65 and 65+ possess, on average, around six times the net wealth of households headed by people aged 25–34.
The OECD also finds evidence that the intergenerational wealth gap widened over time in most of the countries for which long historical comparisons are available.14
That has political consequences.
Older citizens are more likely to own property.
They are more exposed to asset values.
They are more dependent on pension and healthcare systems.
They generally have more wealth to protect.
Younger citizens are more dependent on wages, housing availability, economic mobility and future growth.
Those interests are not automatically opposed.
But they are not identical either.
And ageing democracies inevitably place more electoral weight on the preferences of older voters.
It is therefore entirely reasonable to investigate whether European political economy has become increasingly optimised around protecting accumulated assets and entitlements rather than maximising new construction, new companies, labour mobility and productive investment.
What the evidence does not prove is a deliberate conspiracy by a “boomer elite” attempting to preserve the system until they die.
That claim would require evidence of intent that macroeconomic data cannot provide.
Fortunately, no conspiracy is required.
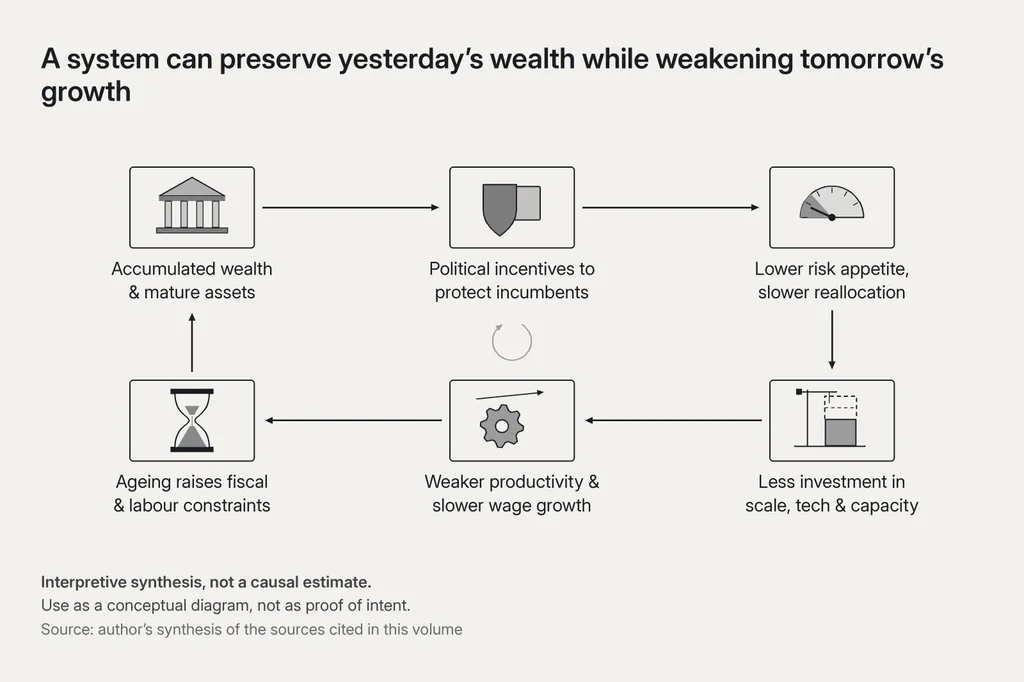
Systems can produce destructive outcomes through incentives alone.
A homeowner votes against new housing because scarcity supports the value of the home.
An incumbent company supports rules that raise barriers to new competitors.
A government protects pension promises because cutting them is electorally toxic.
A regulator adds another layer of process because the political cost of an invisible missed opportunity is lower than the cost of one visible failure.
A bank finances mature collateral because it is safer than financing uncertain innovation.
Each decision can be individually rational.
Together they can create stagnation.
That is a more serious accusation than generational selfishness.
Because it describes a system that can continue without anyone consciously choosing the final outcome.
Migration does not fit comfortably into either political story
Europe’s migration debate is often reduced to two slogans.
One side presents migration as an economic necessity.
The other presents it as the cause of stagnation.
Neither is sufficient.
In 2024, 4.2 million people immigrated into the EU from non-EU countries, while another 1.5 million moved between EU member states. Eurostat notes methodological exclusions in the non-EU figure, including treatment of some asylum seekers and people under temporary protection.15
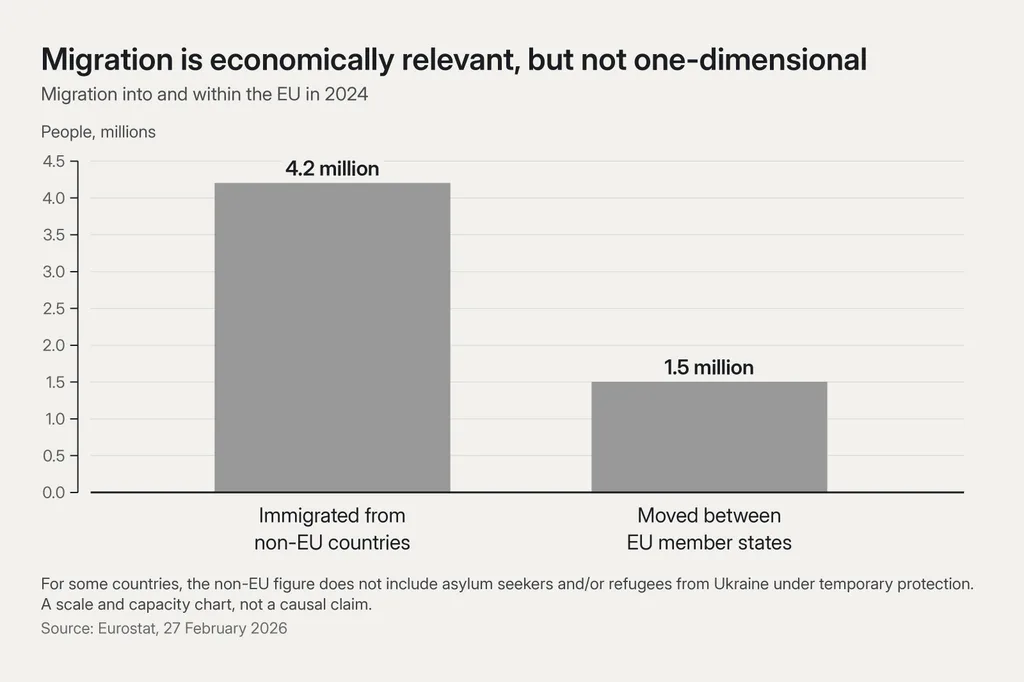
The scale is economically significant.
But migration can increase aggregate GDP without automatically improving GDP per capita.
It can increase labour supply while also increasing demand for housing, transport, schools and healthcare.
It can relieve demographic pressure while simultaneously creating local infrastructure pressure.
An IMF study estimated that around two thirds of the jobs created in the EU between 2019 and 2023 were filled by non-EU citizens, while EU-citizen unemployment remained historically low.
The same study estimated that stronger-than-expected migration could raise euro-area potential output by around 0.5 percent by 2030.16
That is evidence of economic benefit.
It is not evidence that every migration policy is optimal.
The economically useful questions are more specific:
What skills arrive?
How quickly are those skills recognised?
How many migrants work?
At what productivity?
What is the fiscal contribution over the life cycle?
How much additional housing is built?
How quickly does infrastructure expand?
What happens to GDP per capita rather than total GDP?
A government that expands population without expanding productive capacity can make headline GDP look better while worsening citizens’ experience of scarcity.
That possibility deserves measurement rather than ideology.
Europe knows
Perhaps the most damning part of this story is that very little of it is unknown.
Mario Draghi’s competitiveness report concluded that the EU would require an additional €750–800 billion of investment every year to meet its existing competitiveness, digital, energy and security objectives.
That is an extraordinary number.
It implies an investment effort comparable to levels Europe has not seen since the 1960s and 1970s.17
The IMF has described Europe’s problem as “policy drift”.
Its simulations show that without stronger growth, fiscal adjustment and reform, the debt ratio of the average European country could reach around 130 percent of GDP by 2040.18
The diagnosis exists.
The reports exist.
The conferences exist.
The policy papers exist.
The missing ingredient is not awareness.
It is execution.
The dangerous comfort of accumulated wealth
Wealth can hide weakness for a long time.
A family with a large inheritance can maintain an impressive lifestyle while consuming principal.
A corporation can protect earnings for years by underinvesting.
A country can preserve living standards by borrowing, taxing accumulated wealth, importing labour and allowing infrastructure to depreciate more slowly than people notice.
None of these strategies fails immediately.
That is precisely the problem.
Decline is politically easiest to tolerate when it is gradual.
The roads still work.
The universities are still respected.
The hospitals still function.
The old companies still exist.
The houses are worth more than ever.
The pension arrives every month.
There is no single day on which society receives a notification saying:
You have stopped building the future.
Instead, young families notice they cannot buy homes.
Founders discover the growth capital is in America.
Industrial companies place the next plant somewhere with cheaper energy.
Researchers leave for better-funded laboratories.
Software companies sell earlier because the domestic market is fragmented.
Governments discover that every budget is already spoken for.
And eventually a banker says on television that Europe is consuming wealth rather than creating it.
The sentence feels offensive.
Then somebody checks the numbers.
Poland is the most important objection
Any serious argument about European stagnation must confront Poland.
Because Poland demonstrates that geography is not destiny.
Its real GDP per capita more than doubled between 2005 and 2024.4
There are obvious reasons: convergence, EU integration, capital inflows, lower initial income and a different stage of development.
But that does not make the example less valuable.
It makes it more valuable.
Europe contains economic environments capable of substantial catch-up, investment and productivity growth.
Spain’s recent performance provides another useful challenge to the story of uniform European decline.
The correct conclusion therefore cannot be:
Europe cannot grow.
It must be:
Europe has allowed too many mature economies to settle into structures that make meaningful growth unnecessarily difficult.
That means the problem can be changed.
What Europe would have to choose
The remedies are not mysterious.
Europe needs abundant energy.
It needs grids and generation that can support electrification, industrial production and compute.
It needs housing construction at a scale that allows people to move to productive cities without sacrificing half their income.
It needs a capital market capable of financing a European company from seed round to global scale.
It needs a genuine single market for services and digital businesses, not twenty-seven adjacent markets with overlapping friction.
It needs public procurement that creates markets for European technology rather than paperwork for European vendors.
It needs immigration policy designed around economic integration and state capacity rather than slogans.
It needs pension and fiscal systems that recognise demographic reality.
It needs to reward productive investment more than scarcity.
And it needs to stop treating every attempt to build something new as a risk while treating stagnation as the safe option.
Because stagnation is not safe.
It simply distributes the risk into the future.
Ermotti was almost right
Europe is growing.
That part matters.
Precision matters.
But his deeper observation is difficult to dismiss.
The United States has become extraordinarily effective at turning capital, talent, technology and scale into new wealth.
Large parts of Asia are still compounding rapidly.
Europe remains rich enough to disguise its relative deterioration.
For now.
The danger is not that Europe wakes up tomorrow and discovers it has become poor.
The danger is that it wakes up twenty years from now and discovers that the wealth it spent decades protecting was generated by an economy it no longer knows how to build.
Europe does not need to become America.
It does not need to abandon social protection.
It does not need to sacrifice institutions, labour rights or quality of life in pursuit of a quarterly growth number.
But a social model can only distribute what an economy produces.
And a civilisation that wants to choose its future must retain the ability to build it.
Europe is not poor.
Europe is living off yesterday.
The question is how much of tomorrow we are willing to spend before we change course.
Sources
Footnotes
-
CNBC, Squawk on the Street. Interview with Sergio Ermotti, 6 October 2026. Wording as given in the episode’s transcript index: 10am Hour: UBS CEO on US growth, Russia plague risks, nuclear power deal. AWP report on the same interview: UBS-Chef Ermotti: Müssen in den USA vertreten sein. Accessed 2026-10-07. ↩ ↩2
-
AWP, via cash. UBS-Chef Ermotti: Müssen in den USA vertreten sein. 6 October 2026. Also published by finanzen.ch: UBS-Chef Ermotti: Müssen in den USA vertreten sein. Accessed 2026-10-07. ↩
-
World Bank, World Development Indicators. GDP per capita, PPP (constant 2021 international $), NY.GDP.PCAP.PP.KD. 2025 values, rounded. Accessed 2026-10-07. ↩
-
World Bank, World Development Indicators. GDP per capita (constant 2015 US$), NY.GDP.PCAP.KD. Cumulative change calculated as (value 2024 ÷ value 2005 − 1) × 100. Measures real growth within each economy, not a cross-country ranking of living standards. Accessed 2026-10-07. ↩ ↩2
-
International Monetary Fund. World Economic Outlook Update, July 2026: Global Economy in Crosscurrents of War and Technology. July 2026. Country detail: Germany, France, Italy, 2026 Article IV consultation, euro area, 2026 consultation. Forecasts, not observed outcomes. Accessed 2026-10-07. ↩
-
European Central Bank, Economic Bulletin Issue 6/2024. Labour productivity growth in the euro area and the United States: short and long-term developments. Q4 2019 to Q2 2024, per hour worked. Accessed 2026-10-07. ↩
-
OECD. OECD Compendium of Productivity Indicators 2026; chapter Productivity growth in a challenging global environment. Levels compared in constant 2020 PPP terms. Accessed 2026-10-07. ↩
-
European Central Bank, Economic Bulletin Issue 2/2025. Business investment: why is the euro area lagging behind the United States?. Q4 2021 to Q4 2024. The investment proxies exclude some volatile components, including Irish intellectual property products in the euro-area measure. Accessed 2026-10-07. ↩
-
European Central Bank. AI and the euro area economy. 23 March 2026. Digital investment as a share of total investment, 2024 and 2025. Accessed 2026-10-07. ↩
-
European Central Bank, Economic Bulletin Issue 5/2026. Europe’s venture capital gap and the financing of high-growth firms. Based on PitchBook data for VC-type funds that took part in at least one VC deal during 2015–2025. Accessed 2026-10-07. ↩ ↩2
-
European Investment Bank. EIB Investment Survey 2024; EU overview. Accessed 2026-10-07. ↩ ↩2
-
International Energy Agency. Electricity 2025 — Demand; Electricity Mid-Year Update 2025 — Executive summary. Averages for energy-intensive industry; prices for individual firms vary. Accessed 2026-10-07. ↩
-
Eurostat. Old-age dependency growing across EU regions. 1 October 2025. Population aged 65 and over relative to the population aged 20–64. Accessed 2026-10-07. ↩
-
OECD. OECD Employment Outlook 2025, section 2.4.2. Average across 19 OECD economies; not an EU-only measure. Accessed 2026-10-07. ↩
-
Eurostat. Eurostat news, 27 February 2026. For some countries, the 4.2 million figure does not include asylum seekers and/or refugees from Ukraine under temporary protection. Accessed 2026-10-07. ↩
-
International Monetary Fund, Working Paper. Migration into the EU: Stocktaking of Recent Developments and Macroeconomic Implications. September 2024. Working Papers present the authors’ analysis, not necessarily the views of the IMF Executive Board or management. Accessed 2026-10-07. ↩
-
European Commission. The Draghi report on EU competitiveness; Mario Draghi’s presentation address. An estimated investment requirement, not a forecast of actual investment. Accessed 2026-10-07. ↩
-
International Monetary Fund. Regional Economic Outlook for Europe, October 2025 — Overcoming Europe’s Policy Drift: From Recognition to Action; Europe’s Fiscal Squeeze: Tackling Rising Spending Pressures, 2026. The 130 percent figure is a stylised no-policy-action scenario, not the IMF’s baseline forecast. Accessed 2026-10-07. ↩