A dashboard tells you that your AI Visibility Score is 43.7.
It is up 6.2 points this month.
Your nearest competitor sits at 51.4. Your average position in ChatGPT is 2.8. Sentiment is positive. Share of voice is rising. A handful of pages have started appearing as citations.
The interface looks reassuringly familiar. Green arrows. Percentages. Rankings. Competitor tables. Trend lines.
It looks like analytics.
There is only one uncomfortable question.
43.7 percent of what?
For conventional web search, the answer was imperfect but at least conceptually clear. Google knew which queries had been made. It knew which results had been shown. It knew when a page received an impression and when somebody clicked it. Google Search Console exposed part of that first-party telemetry to publishers.
The numbers were incomplete. Average position was never as simple as it looked. Personalisation, geography, result features and sampling complicated interpretation.
But there was an observer.
Someone operated the system and could count what happened inside it.
Generative search has broken that arrangement.
When someone asks ChatGPT which accounting software they should buy, when a traveller asks Gemini where to stay in Kyoto, when an engineer asks Claude to compare database technologies, or when a consumer asks Perplexity for the best running shoes, the outside web publisher generally cannot observe the query.
It cannot see how the question was rewritten.
It cannot see every search performed behind the answer.
It cannot see every document retrieved.
It cannot necessarily see which retrieved documents materially influenced the generated text.
It cannot see the full population of answers.
And it certainly cannot see how many private users were exposed to a particular brand across all of those conversations.
Yet an industry has appeared that claims to measure precisely this world.
It calls the result AI visibility.
The interesting question is not whether that industry is fraudulent.
Mostly, it is not.
There is real engineering underneath the dashboards. There are real prompts, real responses, real citations, real crawlers, real datasets and increasingly sophisticated attempts to estimate demand.
The more important question is whether we are being sufficiently careful about the difference between what was observed, what was estimated, and what we would merely like the number to mean.
That difference may determine not only whether the new metrics are useful.
It may determine what kind of web we build around them.
Search had an observer
Search engine optimisation has always contained an element of reverse engineering.
Google did not tell publishers precisely how its ranking systems worked. SEO practitioners inferred relationships from documentation, experiments, observed rankings and large datasets.
But the surrounding measurement system had unusually strong anchors.
A query happened. A result was rendered. A page received an impression. A user clicked—or did not. Google possessed first-party telemetry for those events and exposed significant parts of it through Search Console.
This did not make SEO science exact. It did, however, distinguish two categories of information.
There was platform telemetry: queries, impressions, clicks, click-through rate, indexed pages, canonicalisation, crawling, and various search appearances.
And there were third-party estimates: keyword volumes, rankings measured from external locations, backlink databases, traffic estimates, authority scores, competitive visibility indexes.
Good practitioners understood that these were different things.
A Semrush traffic estimate was not Google Analytics. A crawler's keyword database was not Search Console. A domain authority score was not a variable Google had secretly exposed.
That boundary used to be easier to keep in view.
Generative search has made it much easier to forget.
The answer economy removed the observer
A generative answer is not simply a search result page written in paragraphs.
It is the output of a pipeline.
A user's original question may trigger web search—or it may not.
If search occurs, the question may first be rewritten into one or more different queries.
OpenAI documents this behaviour for ChatGPT Search. ChatGPT search typically rewrites a query into one or more targeted queries. It also collects general location information based on IP address and may share that general location with third-party search providers. If memory is enabled, ChatGPT may use relevant saved memories when rewriting a search query. [1]
Google describes a related mechanism as query fan-out: a set of concurrent, related queries generated by the model to request more information and fetch additional relevant search results. [2] Fan-out is a retrieval technique inside Google Search. It is not a publisher tactic. The same optimisation guide is blunt about the opposite move: creating many pages for fan-out queries primarily to manipulate generative AI responses is scaled content abuse.
The resulting documents can then be retrieved, filtered, reranked, allocated into limited context, synthesised by a generative model and selectively cited.
The chain runs from question to search decision, query rewriting or fan-out, retrieval, reranking, context allocation, generation, factual absorption, citation, recommendation, and finally user behaviour.
Each step can change the outcome. Most external analytics systems observe only fragments of the chain.
That creates an epistemic problem.
Suppose a brand appears in five of ten ChatGPT answers.
That is observable.
Suppose a vendor converts those observations into AI Visibility = 50%.
That can still be perfectly reasonable if the metric is clearly defined as the share of the measured sample in which the brand appeared.
But the psychological interpretation tends to drift.
The number begins to sound like: fifty percent of users asking relevant questions see this brand.
Nothing in the experiment has demonstrated that.
This is not philosophical pedantry. It is the difference between a sample statistic and a population claim.

One window, not a console
There is an important complication.
On 3 June 2026, Hillel Maoz and Moshe Samet announced dedicated generative-AI performance reporting in Search Console. [3] That post is not John Mueller's. Mueller's related piece, published 15 May 2026, is a different artefact: Google's optimisation guide for generative AI features on Search. [32]
The Search report covers impressions generated by AI Overviews and AI Mode. Publishers can examine those impressions by page, country, date and device. Google also introduced generative reporting for Discover. As of 31 August 2026, these insights have been rolled out to websites worldwide. [3][4]
This changes the argument.
It would now be wrong to say that no first-party visibility telemetry exists anywhere in generative search.
Some does. Google has begun exposing it.
It has even created a Search Console control that lets a publisher include or exclude its site from Google's generative Search features, including AI Overviews, AI Mode and generative features in Discover. [5] The control is property-level. It is not a URL-level or query-level switch, and Google says it is not used as a ranking or inclusion signal for other parts of Search.
For at least one major ecosystem, part of the black box is becoming observable.
But look closely at what the dedicated Search report currently provides.
Impressions.
Not a complete transcript of user questions. Not every generated answer. Not every fan-out query. Not the complete retrieval set. Not a provenance graph showing which sentence was influenced by which source. Not a universal ranking position. And certainly not equivalent telemetry for ChatGPT, Claude, Perplexity, Grok and every other answer engine.
The Search Console that does not exist is therefore no longer literally nonexistent.
A better description is: there is no cross-platform Search Console for the answer economy.
Google has built one window into one part of the system. The rest of the building remains largely dark.
Even first-party telemetry should not be romanticised as perfect ground truth. Google maintains an anomaly log documenting occasional failures in its own reporting infrastructure. Between 13 and 17 August 2026 a logging error decreased impressions on the generative-AI Search performance report; the missing data was restored on 21 August. A separate logging error on 13 August affected Discover and generative AI in Discover. [6] Those were reporting failures, not ranking drops, and they were not "all of August."
First-party measurement is enormously valuable.
It is not infallibility.
What can actually be measured
The most useful way to think about generative visibility is to begin with the parts that require the fewest assumptions.
A prompt can be observed. A researcher can submit: which password managers are best for a 20-person company? The exact text is known. The time is known. The engine can be recorded. The country or proxy location may be controlled. The account or API configuration can be documented. This is an experimental input.
A response can be observed. The resulting answer can be archived: which brands were mentioned, where they appeared, which URLs were visibly cited, which domains appeared, answer length, whether explicit recommendations were made, whether positive or negative claims were made. These are observations.
Repetition can be measured. Run the same prompt one hundred times. If Brand A appears in 63 of those 100 runs, there is nothing questionable about that number. The correct interpretation is simply: Brand A appeared in 63 percent of these one hundred measured responses under these experimental conditions.
That is already useful.
What becomes problematic is deleting the final six words.
Citations can be measured. If an answer visibly links to a page, the citation exists. Across repeated observations we can calculate citation frequency, domain diversity, citation overlap and change over time. This is one of the most robust measurements available to outside researchers.
Referral traffic can be measured. OpenAI documents that ChatGPT automatically includes the UTM parameter utm_source=chatgpt.com in referral URLs. [7] A publisher can therefore measure at least some real downstream traffic originating from ChatGPT. That is no longer synthetic visibility. That is behaviour.
Crawler requests can be measured. Web server logs can record crawlers requesting pages. OpenAI's publishers FAQ treats OAI-SearchBot as the agent relevant to summaries and snippets in ChatGPT, provided it is not blocked. GPTBot appears in a separate question, as a training-related control rather than as the search-inclusion crawler. [7] Google publishes its own crawler documentation. Independent crawler settings are documented separately. [7a]
Again, this is real telemetry. But a crawl means a crawler fetched a resource. It does not automatically mean the resource was indexed, retrieved for a later question, absorbed into an answer, cited, shown to a user or responsible for a purchase.
The stages must remain separate.
What is inferred
The next category is not fake.
It is simply model-dependent.
Share of voice. If our prompt corpus produces 1,000 responses and Brand A receives 400 mentions while its competitors collectively receive 600, we can construct a share-of-voice metric. Peec, for example, defines visibility as the percentage of AI responses in which a brand appears, and share of voice as that brand's mentions divided by all tracked-brand mentions. [30] The number describes relative representation inside the experimental corpus. That can be useful. But its external validity depends almost entirely on whether the prompt corpus resembles the population we care about. A share of voice measured over one thousand badly chosen prompts is merely a precise description of a badly chosen experiment.
Average position. Several tools calculate a brand's average order when it appears inside an answer. This is mathematically possible. The conceptual problem is that generated answers are not necessarily ranked lists.
Consider: Acme is the conventional option and probably the safest choice. Foo and Bar are also common. For organisations with unusually strict sovereignty requirements, however, Baz may be considerably more appropriate.
What position is Baz? Fourth because it was named fourth? First because it received the strongest conditional recommendation? Second because it occupied the largest paragraph?
The researcher must define the answer. That definition may still be useful. But it is not a hidden native ranking variable extracted from the model. It is an operationalisation created by the analytics system.
Sentiment. Generated language can be classified as positive, neutral or negative. Modern language models are very capable sentiment classifiers. A score can therefore describe the tone surrounding brand mentions in observed responses. But a phrase such as "AI perceives your brand positively" smuggles in a stronger claim. The system does not expose a durable internal variable called brand_trust = 78. The metric means: observed generated statements about this brand were classified as predominantly positive under this methodology. Again, useful. Again, different.
Prompt volume. This is the hardest commercial problem. If a company tells a marketer that 18,700 people ask ChatGPT this question every month, where did that number come from? The answer cannot simply be OpenAI's private global query log unless OpenAI supplied it.
Different vendors therefore construct different approximations.
Ahrefs anchors its prompt universe in its keyword database and Google's People Also Ask data, expands the corpus semantically, executes questions through public AI interfaces, and describes estimated impressions as potential visibility, not actual audience reach. Using Google search volume as an AI-demand weight is, in Ahrefs' own words, a modelling choice rather than a measured relationship. [8]
That is methodologically honest.
Semrush takes another path. It says its AI visibility datasets combine large-scale clickstream observations of actual AI-search behaviour with Google keyword data, organised into topics. The live database is 317 million-plus prompts and responses, not a census of an audience. Semrush also states that no platform can provide exact numbers on visibility. [9][10]
Profound licenses prompts from double-opt-in consumer panels, applies anonymisation and probabilistic modelling, and scales volumes to reflect a broader population. [11] That is analogous to audience measurement. It can produce valuable estimates. It remains an estimate.
A panel projection can be very good.
It is still not OpenAI's query log.
The prompt universe is the hidden variable
The central problem may not be the language model at all.
It may be the questions.
Imagine three companies measuring the same brand.
Company A begins with Google keywords.
Company B asks an LLM to generate likely buyer questions.
Company C collects real questions from sales calls, support tickets and consumer panels.
All three then run perfect experiments.
Their answers could be: Visibility 31 percent. Visibility 47 percent. Visibility 68 percent.
None of those numbers has to be fraudulent.
They may simply describe three different populations.
AirOps makes this problem unusually explicit. Its Prompt Discovery system, announced 30 April 2026, combines panel data, People Also Ask patterns, search intent and first-party conversations from systems such as Gong, Zendesk and Intercom. Prompt Mining, announced 25 March 2026, treats first-party buyer language as a continuously updated prompt universe. AirOps argues that no single source captures how people ask questions, and that first-party buyer language differs from broad market signals. The volumes it surfaces are estimates. [12][13]
That is an important admission.
The prompt universe sets the boundary of the measurement. It determines what topics exist, which intents matter, what language represents them, how much commercial versus informational demand is present, which niches are overrepresented, and which questions never enter the experiment.
A dashboard can calculate ten decimal places after that decision.
The biggest modelling choice has already happened.
This is a familiar problem in survey research. A perfectly analysed survey of an unrepresentative population does not become representative because the confidence interval is narrow.
The same is true here.
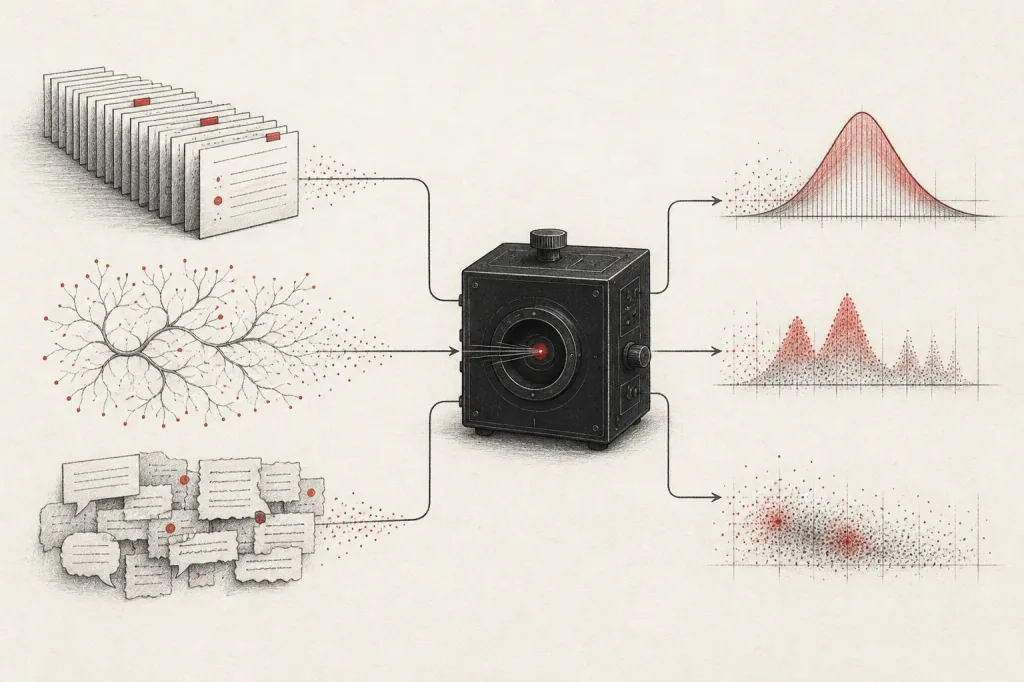
Repetition does not solve representativeness
One of the better developments in AI-visibility tooling is increased recognition that generative answers are non-deterministic.
Gumshoe states the issue directly: ask the same model the same question repeatedly and brands, recommendations and citations can change. Its audits therefore aggregate across prompts, personas and models. The company reports approximately ±5 percentage points at 95 percent confidence for its default overall visibility measurement. That claim is for the default overall score, not for topic or persona slices, where intervals widen. The framework is API-only and persona-first. [14]
That is a substantial methodological improvement over screenshots. It treats the output as a distribution.
But a confidence interval answers a specific question. It estimates uncertainty conditional on the experimental design.
Suppose we generate synthetic personas: a cost-sensitive startup founder, an enterprise CIO, a German procurement director, a student, a privacy-conscious family. Then we sample them extensively. Our statistical confidence might become extremely high. But the experiment has still not demonstrated that these personas occur in the real user population at the assumed proportions.
Internal validity asks: given our chosen prompts, personas and models, how stable is the result?
External validity asks: does this experimental population represent the people whose behaviour we actually care about?
Repetition helps the first.
It cannot automatically solve the second.
You can measure the wrong population with exquisite precision.
The models themselves do not agree
Even before considering repeated runs of the same engine, different engines retrieve different worlds.
On 22 July 2026 Samanyou Garg published, on the Writesonic blog, an analysis of 161,286 prompts across ChatGPT, Gemini, Perplexity and Google AI Overviews. The core four-way set—prompts with citations from all four engines—was 70,879. Using domain-level Jaccard similarity, pairwise overlap ranged from 0.119 to 0.237. The highest pair was Perplexity and Google AI Overviews, at 0.237. ChatGPT's overlap with the other systems was particularly low. [15]
This is vendor research, and it should therefore be treated as such.
But the dataset is large, the methodology is disclosed, and the finding aligns with the broader architecture of these systems: different search providers, models, rerankers and context-selection strategies should be expected to produce different source populations.
There may be no meaningful universal variable called AI rank.
There may instead be the probability that a brand appears, given engine, prompt, wording, geography, context and time.
That is a very different object.
An organisation can be highly visible in Perplexity, weakly represented in ChatGPT and strongly cited in Google AI Mode. Compressing those states into one headline number may be commercially convenient. It can also erase the most useful information.
Visibility is a distribution, not a position
Recent academic work now gives this intuition stronger empirical grounding.
A 2026 study by Ronald Sielinski repeatedly sampled generative search systems across multiple topics and found substantial citation variability across identical or equivalent measurements. Bootstrap confidence intervals showed that many apparent differences between domains fell inside the statistical noise of the measurement process. Ranking instability occurred throughout citation distributions, not only at the tail. [16]
The implication is straightforward.
A dashboard displaying Brand A at 43.7 and Brand B at 47.2 may invite the conclusion that Brand B is performing better. But if the uncertainty intervals overlap substantially, the defensible conclusion may instead be: we currently cannot distinguish their visibility with sufficient confidence.
Traditional business dashboards dislike sentences like that.
Science depends on them.
A score without its sample size hides how much evidence produced it. A score without its uncertainty hides how much movement might be noise. A score without its prompt frame hides the population it actually describes. A score without its engine and context hides where the observation occurred.
The decimal point is often the least important piece of information on the screen.

Citation is not provenance
There is another tempting shortcut.
A system cites a page. We conclude: this page caused the answer.
That relationship is not guaranteed.
A search-enabled language model may visit multiple pages, retrieve overlapping information, use one source to inform its internal synthesis and visibly cite another.
Research using 13,929 search-enabled LMArena conversation logs documented what its authors call an attribution gap between pages apparently consumed by the system and pages actually credited in the output. The full title of that paper includes Estimating Ecosystem Exploitation. [17]
This suggests at least three distinct phenomena.
Retrieval: the system accessed a source.
Absorption: information from the source materially entered the generated answer.
Citation: the source received visible attribution.
These are not interchangeable.
A source can be retrieved and not cited. A claim can appear without complete provenance. A citation can accompany a paragraph without proving that the cited page alone caused the wording.
This matters commercially because many GEO strategies are already optimising toward citations.
If citation becomes the metric, publishers will optimise for citation. But citation frequency is not the same as informational influence. Informational influence is not necessarily the same as recommendation. Recommendation is not necessarily the same as commercial outcome.
The measurement chain must remain open.

GEO is real. Its strongest claims are not yet established
The foundational Generative Engine Optimization paper by Pranjal Aggarwal and colleagues formalised GEO as a problem and demonstrated that modifying content could increase its visibility in controlled generative-engine experiments. The abstract reports boosts of up to 40 percent. Those gains were measured in an already-retrieved top-5 context, not as organic discoverability across the open web. [18]
That result matters. Content characteristics can affect generative output.
The mistake is to convert that result into a stronger proposition: therefore we know how to make an arbitrary webpage organically rank higher in ChatGPT.
The experiment does not establish that.
A major 2026 critical survey of 45 GEO studies, by Olivier Martinez, draws exactly this distinction. It describes generative visibility as a stochastic, partially observable pipeline involving search activation, crawling and indexing, retrieval, reranking, context allocation, citation, prominence, factual absorption, fidelity and user behaviour. [19]
According to the survey, the foundational GEO findings are valid within their experimental setting but often concern content already available within a controlled context. Gains are conditional on the source already being in context. That is different from proving the entire organic chain: publish, crawl, index, retrieve, rerank, enter context, influence the answer, receive a citation, receive a recommendation, generate traffic, generate a business outcome.
The survey found evidence that already-retrieved content can causally affect how it is cited or used. It did not find a reviewed technique demonstrating a stable, longitudinal and cross-platform causal effect on organic discoverability and downstream behaviour. [19]
The correct position in 2026 is neither "GEO works" nor "GEO is fake."
It is: some interventions demonstrably affect generative answers under controlled conditions. Evidence becomes progressively weaker as the claimed effect moves further down the real-world causal chain.
That is what an immature research field normally looks like.
Some vendors are more careful than others
The AI visibility industry is not methodologically uniform.
That is worth recognising.
Ahrefs explicitly tells users that its estimated impressions are modelled and should not be interpreted as actual audience reach. [8]
Otterly, in a 17 July 2026 help article, says it queries public web interfaces rather than relying primarily on model APIs—Claude is the documented API exception—and monitors tracked prompts daily. It warns that a personal ChatGPT result can differ because of session, location and account settings. [20]
Gumshoe embraces repeated sampling and uncertainty reporting but chooses an API-based, persona-driven experimental framework. [14]
Trakkr openly describes its broad Research product as sampling. It generates roughly 500 discovery questions and samples each once. Separately tracked prompts are observed against all eight models every day. [21]
Semrush grounds part of its prompt universe in clickstream data representing real user behaviour. [9]
Profound uses opt-in consumer panels plus probabilistic extrapolation. [11]
AirOps combines market-level and first-party prompt sources. [12]
These are materially different scientific objects.
A buyer comparing only feature checkboxes—ChatGPT, Gemini, sentiment, citations—can easily miss the more important questions. Where did the prompts come from? Which interface was measured? How often was each condition repeated? What population is the resulting score intended to represent? Where does observation end and modelling begin?
The most trustworthy vendors tend to explain those boundaries.
The least trustworthy metric is not necessarily the one with the weakest algorithm.
It may simply be the one whose marketing description has drifted furthest from its measurement protocol.
A concrete example of why technical precision matters
Orchly was the product that originally triggered this research.
Its core proposition is technically plausible. The platform says it runs prompts against AI interfaces, records mentions, citations, sentiment and competitors, and reports visibility across systems including ChatGPT, Perplexity, Gemini and Google AI experiences. [22]
None of that requires magic.
But some documentation illustrates how quickly precision can slip.
Orchly states that prompts run from different locations and IP addresses and that the resulting measurements reflect "geography and personalization included." [22]
Geographical variation can certainly be introduced experimentally.
Personalisation is a stronger concept.
OpenAI documents that ChatGPT Search may incorporate saved memory when rewriting a query. [1] A clean synthetic session from Zurich is therefore not automatically equivalent to a real user's long-running ChatGPT account in Zurich. A system can control geography without reproducing personal history.
Those should not be conflated.
There is an even clearer example.
Orchly's traffic documentation classifies Google-Extended alongside bots that can appear as request-level entities in traffic logs and describes it, in Orchly's taxonomy, as an "AI Chatbot" visit. [23]
Google's own technical documentation, last updated 14 July 2026, says that Google-Extended has no separate HTTP request User-Agent string. It is a robots.txt product token used to control certain uses of content crawled through existing Google user agents. [24]
That does not prove Orchly's underlying product is invalid.
It does demonstrate why independent verification matters.
When a category sells observability into systems that are already difficult to observe, seemingly small terminology errors can create false causal stories.
A row in an access log is evidence.
What that row means requires considerably more care.
Google's warning is unusually direct
Google has now published its own guidance about third-party SEO, AEO and GEO tools.
It does not say they are useless.
It says something more precise.
Google does not evaluate those third-party services. They do not have access to Google's internal ranking data or AI systems. They cannot guarantee performance. Predictions are their own, and publishers should evaluate claims against official guidance and first-party Search Console data. [25]
This is almost exactly the boundary the industry needs.
Third-party measurement has always been valuable. Ahrefs did not need Google's internal PageRank database to become useful. Semrush did not need Google's complete query logs to produce valuable competitive intelligence.
But useful third-party observation becomes dangerous when the modelled object is presented as if it were platform telemetry.
The solution is not to stop measuring.
The solution is to label measurements correctly.
A better object than AI visibility
The critical GEO survey proposes a multistage view separating discoverability, citation, absorption and outcomes. [19]
Building on that framing, a practical observatory should resist collapsing the system into a single score.
One useful representation is a vector: discoverability, retrieval, citation, absorption, prominence, economic outcome.
Discoverability asks whether the system can find or access the content at all. Possible evidence includes crawler access, index eligibility, Search Console state, successful direct retrieval, and robots controls.
Retrieval asks, under defined query conditions, how often the source or brand enters the observable retrieval or answer set. This is frequently latent outside APIs that expose search traces, so the method must say when retrieval is observed and when it is inferred.
Citation asks how often the source receives visible attribution. This is directly observable in responses that expose citations.
Absorption asks how often distinctive information from a source materially appears in the generated answer. This is harder. It may require controlled factual markers, semantic comparison and human validation.
Prominence asks how strongly the resulting answer foregrounds the brand or source. Possible measures include first mention, recommendation status, textual order, answer share and strength of endorsement. None should pretend to be a universal native rank.
Economic outcome asks what eventually happened: referral, visit, engaged session, lead, purchase, subscription, or another meaningful action. This is where visibility becomes commercially relevant.
Not every project needs every dimension.
The important part is refusing to substitute one for another.
A citation is not a sale. A crawl is not a citation. A mention is not market share. An impression is not persuasion.

We should measure the measurement
At this point, another essay criticising GEO dashboards would not be enough.
The useful next step is empirical.
Not: how do we increase the Studio's AI Visibility Score?
But: how stable, representative and causally meaningful are the measurements from which such a score would be constructed?
The first question starts by accepting the metric.
The second asks whether the metric deserves to become an objective.

What we will actually run
The observatory proposed here is a set of measurements, not a dashboard product. Nothing below is a result. It is a protocol that has not yet been executed.
Begin with one commercial-intent question—which password managers are best for a small company?—and refuse the idea of "the ChatGPT answer." Run it repeatedly. Not once. Not three screenshots. Perhaps fifty or one hundred times per engine. Record brands mentioned, recommendation order, cited URLs and domains, search activation where observable, answer length, factual claims, timestamp, region, and model or product surface. What you get is a response distribution. Brand A might be recommended first in 31 percent of runs, second in 18, mentioned elsewhere in 22, and absent in 29. That is a richer object than Average AI Rank: 2.4.
Then hold the underlying need constant and change the words. What is the best password manager for a small business? Which password manager would you recommend to a 20-person company? What are good password-management tools for SMEs? If I run a small company, which password manager should I buy? The semantic intent is similar. The wording is not identical. If brand and citation outcomes move substantially, prompt formulation itself is a major source of measurement uncertainty. A vendor does not merely observe your visibility. By selecting the prompt phrasing, it partially defines the world in which your visibility is measured.
Three prompt universes
Construct three independent prompt corpora for the same categories: one from traditional keyword and People Also Ask data; one generated systematically by language models to cover relevant buyer intents; one derived from real buyer language—consumer panels, forums where appropriate, support tickets, sales calls, first-party inquiries. Measure identical brands and engines against each corpus. If search-derived prompts give 42 percent, synthetic coverage 58 percent, and observed buyer questions 31 percent, all three results may be mathematically correct. The difference would demonstrate that the headline score is inseparable from its sampling frame. That may be the most commercially important experiment in the entire project.
Surfaces, geography, and cause
Many vendors choose APIs because they are stable, permitted, scalable and reproducible. Others deliberately query public interfaces because they argue that APIs do not reproduce what a normal user sees. This should be tested rather than debated: API condition and product-for-individuals condition, equivalent prompts and geography as far as possible, then brand overlap, citation overlap, recommendation overlap, source Jaccard similarity, output distributions. If they strongly agree, API-based measurement gains credibility as a proxy. If they systematically diverge, "we measure ChatGPT" becomes an incomplete description unless the vendor specifies which ChatGPT surface.
Technical feasibility is not the same as contractual permission. OpenAI's Terms of Use, effective 1 January 2026, apply to ChatGPT, DALL·E and other services for individuals. They prohibit automatically or programmatically extracting data or Output. [26] That prohibition should not be applied, by sleight of hand, to API or Enterprise terms. Any observatory of the individual product therefore needs a platform-by-platform compliance decision. For ChatGPT under those terms, the study should use manual collection or explicit authorisation rather than automated scraping unless the governing terms change. Methodology includes legality.
Run equivalent prompts from Switzerland, Germany, the United Kingdom, the United States and Japan. Where products allow account states or memory conditions to be controlled, separate a clean session from an established account, memory disabled from memory enabled. The goal is not to imitate every real human being. That would be impossible. The goal is to quantify how large these context effects can become. If Brand A appears in 72 of 100 Swiss runs and 18 of 100 American ones, a global visibility score is actively concealing information.
Create content containing distinctive factual elements that can be traced with high confidence. Ask questions for which those facts are relevant. Classify each run into a simple grid: cited and absorbed; cited without clear absorption; unattributed absorption; no observed influence. Human validation would remain necessary. The experiment would begin to separate a phenomenon that current analytics frequently collapses: being cited, from shaping the answer. A world in which your work informs an answer but somebody else receives the citation is economically and culturally different from a world in which your work is both used and credited.
Finally, test the promise at the heart of GEO. Select comparable website pages. Create matched treatment and control groups. One treatment improves semantic hierarchy, explicit entity naming, concise factual statements, evidence links, canonical metadata, structured data and machine-readable presentation. Another applies commonly recommended generative-search techniques. A third provides a deliberately clearer machine interface: stable semantic content, structured resources, accessible markup, explicit capabilities. Then observe both groups before and after. Do not subtract before from after and call it causality. Compare the change in the treated group with the change in the control group. This still does not eliminate every confounder. Models change. Indexes refresh. Competitors publish. Retrieval systems evolve. But a treatment/control design is considerably stronger than: we rewrote the page and the dashboard went green.
A manageable first wave could be five commercial categories, ten underlying intents, three semantic formulations, ten repetitions and five engines: 7,500 observations. If the protocol survives, the same discipline can expand. Scale matters less than the record. Every observation should preserve experiment identifier, timestamp, engine, product surface, model where available, region, account or session state, prompt family, exact prompt text, raw response, citations, extracted mentions, observed search metadata where available, and software or protocol version. Raw records should be immutable. Derived scores should always be rebuildable from them. No dashboard number should exist without a path back to its evidence.
The study should begin by trying to falsify itself
A serious research project should not begin with: AI visibility dashboards are nonsense.
It should begin with hypotheses that might prove the opposite.
For example:
H₀: repeated AI visibility measurements are sufficiently stable that point estimates are operationally useful.
H₁: identical prompts produce material run-to-run variation.
H₂: semantic paraphrasing introduces greater variance than identical repetition.
H₃: engine choice explains more variance than prompt wording.
H₄: API and product-for-individuals observations differ materially.
H₅: apparent "rank" is less stable than simple brand presence.
H₆: citation probability is less stable than mention probability.
H₇: the choice of prompt corpus materially changes comparative visibility scores.
H₈: controlled website interventions produce smaller or less stable effects than naïve before/after dashboards imply.
Some of these hypotheses may fail.
That would be valuable.
If a particular visibility measure turns out to be remarkably stable, reproducible and predictive of first-party outcomes, then the skeptical thesis should change.
A good observatory is capable of proving its creator wrong.
Confidence belongs on the dashboard
Statistical analysis should treat the intent family, not every paraphrase or repeated call, as the fundamental cluster where appropriate. Repeated observations of five paraphrases of the same question are not five independent human intents.
Useful methods include cluster bootstrap confidence intervals, hierarchical or mixed-effects models, GEE for repeated binary outcomes, Jaccard similarity for source sets, Kendall or Spearman measures for rank stability, variance decomposition across engine, intent, wording and time, multiple-testing correction, and difference-in-differences for interventions.
The exact method can evolve.
The principle should not.
Instead of AI Visibility: 43.7, show mention probability 44 percent, a 95 percent interval of 39–49 percent, 82 intent families, 1,640 observations, Switzerland, ChatGPT individual-product condition, protocol v1.2, last sampled 31 August 2026.
The second interface looks less magical.
It is much more useful.
Google gives us a calibration experiment
There is now an unexpected opportunity.
Because Google has started providing first-party generative impressions in Search Console, we can compare synthetic visibility measurements against actual platform telemetry.
That is potentially one of the most valuable experiments available.
For participating Studio pages: record first-party generative impressions from Search Console; independently run synthetic AI Mode and AI Overview monitoring against a frozen prompt set; compare trends; test whether synthetic visibility predicts changes in actual impressions; examine whether citation and mention proxies correlate with referral traffic and engagement.
The question becomes: does the thing visibility vendors measure predict the thing a platform can actually count?
That is the calibration problem the market currently lacks.
The answer could vindicate some methodologies. It could expose others.
Either outcome would be useful.
Measurement does not remain neutral
There is a larger reason to care.
Metrics do not merely describe systems. Once institutions reward them, they change those systems.
Goodhart's law is usually paraphrased as: when a measure becomes a target, it ceases to be a good measure. The formulation comes from Charles Goodhart's 1975 paper "Problems of Monetary Management: The UK Experience," published in the Reserve Bank of Australia's Papers in Monetary Economics. [27]
Donald Campbell's related formulation emphasises how quantitative indicators used for decision-making become subject to pressures that distort the processes they were intended to monitor. The source is "Assessing the impact of planned social change," Dartmouth Occasional Paper No. 8 (December 1976), later Evaluation and Program Planning 1979. [28] Jeffery Rodamar's 2018 Significance essay traces the relationship between the two formulations. [29]
SEO provides a historical demonstration.
Once search ranking became economically valuable, websites changed. Headlines changed. Page structures changed. Publishing schedules changed. Entire article categories emerged because keyword tools showed demand. Affiliate content expanded. Backlink markets formed.
The measurement apparatus did not merely observe the web.
It helped shape the web.
AI visibility metrics are beginning the same process.
If the metric rewards mentions, publishers will engineer mentions. If it rewards citation frequency, content will be engineered for citations. If listicles are disproportionately visible, more listicles will appear. If simplistic factual structures produce higher proprietary scores, the web will increasingly adopt those structures. If third-party mentions count more than first-party expertise, companies will purchase third-party presence. If machine-readable summaries outperform nuanced argument, nuance acquires an economic penalty. And if a single synthetic score becomes a marketing KPI, teams will optimise for the score regardless of whether it predicts human value.
This is no longer a measurement problem.
It is an incentive-design problem.

The danger is not that the metrics are fake
Calling the entire field fake science would be satisfying and mostly wrong.
The engineering is real. The observations are real. The statistical problems are familiar. The better vendors disclose meaningful parts of their methodology. Some datasets are genuinely impressive.
The danger is subtler.
It is that the industry adopts premature certainty.
A sequence such as: we sampled this system. Becomes: we measured AI visibility. Then: AI visibility is 43.7. Then: AI visibility increased because we changed this page. Then: this technique improves your position in AI. Then: optimise every page for the metric.
Each sentence requires a larger inference than the one before it.
Eventually the dashboard has travelled much further than the evidence.
A credible measurement system for the answer economy should answer five questions before displaying a score. What was observed—an actual prompt, response, citation, crawler request, impression or referral? What was sampled—which engines, prompts, locations, sessions and dates? What was modelled—prompt demand, population weighting, sentiment, share of voice, inferred retrieval? How uncertain is it—sample count, variation, confidence interval, longitudinal drift? What causal claim is being made—correlation, controlled intervention, or merely an attractive before/after chart?
This standard would not kill AI visibility analytics.
It would make the category better.
The missing console
Perhaps Google Search Console trained us to expect too much.
For a brief historical period, one dominant discovery system provided publishers with a partial first-party window into the machinery distributing their work.
Generative discovery is fragmenting that visibility again.
Different engines search differently. Different models cite differently. Private conversations remain private. Prompts are effectively unbounded. Personal context alters retrieval. The full provenance chain is rarely exposed.
There may never be one canonical Search Console for this ecosystem.
That does not make measurement impossible.
It makes epistemic discipline more important.
We can run prompts. We can archive answers. We can measure variation. We can inspect citations. We can track crawlers. We can observe referrals. We can use panel data. We can compare engines. We can perform interventions. We can calculate uncertainty. We can correlate synthetic metrics with the first fragments of first-party generative telemetry now appearing.
There is plenty to measure.
We simply have to stop pretending that every measurable proxy is the thing itself.
The answer economy does not need fewer metrics.
It needs metrics that remember where they came from.
Because eventually those numbers will become targets.
And once they become targets, they will begin rebuilding the web in their image.
The important question is therefore no longer only: can we measure AI visibility?
It is: what exactly are we choosing to measure—and what will the web become when everyone starts optimising for it?
The empirical work described here is a proposed observatory, not a result. No multi-engine pilot results, website intervention effects or cross-platform visibility conclusions are claimed until those measurements have actually been collected and analysed.
Sources
[1] OpenAI. Searching the web with ChatGPT. OpenAI Help Center. Documents that ChatGPT search typically rewrites a query into one or more targeted queries; collects general location from IP; and, if memory is enabled, may use relevant saved memories when rewriting a search query. https://help.openai.com/en/articles/9237897
[2] Google Search Central. Optimizing your website for generative AI features on Google Search. Published 15 May 2026; last updated 10 July 2026. Documents retrieval-augmented generation and query fan-out as concurrent related queries generated by the model. Creating pages for fan-out queries primarily to manipulate generative AI responses is scaled content abuse. https://developers.google.com/search/docs/fundamentals/ai-optimization-guide
[3] Hillel Maoz and Moshe Samet. Introducing Search Generative AI performance reports in Search Console. Google Search Central Blog, 3 June 2026. https://developers.google.com/search/blog/2026/06/gen-ai-performance-reports — and Google Search Console Help. Generative AI performance report (Search). Impressions for AI Overviews and AI Mode. Worldwide as of 31 August 2026. https://support.google.com/webmasters/answer/16984139
[4] Google Search Console Help. Generative AI performance report (Discover). Worldwide as of 31 August 2026. https://support.google.com/webmasters/answer/16983858
[5] Google Search Console Help. Search generative AI control. Property-level include/exclude for AI Overviews, AI Mode and generative Discover features. Not a ranking signal for other parts of Search. Worldwide as of 31 August 2026. https://support.google.com/webmasters/answer/16908024
[6] Google Search Console Help. Data anomalies in Search Console. 13–17 August 2026 generative-AI Search impression logging error, restored 21 August; 13 August Discover and generative AI in Discover logging error. Logging only. https://support.google.com/webmasters/answer/6211453
[7] OpenAI. Publishers and Developers — FAQ. Documents utm_source=chatgpt.com on referral URLs, and (in separate questions) OAI-SearchBot for summaries and snippets if not blocked, and GPTBot as a training-related control. https://help.openai.com/en/articles/12627856
[7a] OpenAI. Crawlers overview. Independent robots.txt controls for each bot. https://developers.openai.com/api/docs/bots
[8] Rebekah Bek / Ahrefs. Ahrefs Brand Radar Methodology: How we collect and model AI visibility data. Updated 26 February 2026. Estimated impressions as potential visibility, not actual audience reach; Google volume as a modelling choice, not a measured relationship. https://ahrefs.com/blog/brand-radar-methodology/
[9] Semrush. Where does the data in Semrush's AI Visibility Toolkit come from? Clickstream plus Google keyword data; 317 million-plus prompts; no platform can provide exact numbers on visibility. https://www.semrush.com/kb/1607-semrush-ai-visibility-data
[10] Semrush. Semrush data (2026 glance). Supporting 317 million-plus AI prompts figure. https://www.semrush.com/kb/997-semrush-data
[11] Profound. Prompt Volumes. Double-opt-in consumer panels, anonymisation, probabilistic modelling, volumes scaled to reflect the full population. https://www.tryprofound.com/features/prompt-volumes
[12] AirOps. Prompt Discovery: Build a Prompt Universe You Can Actually Trust. 30 April 2026. Panel data, People Also Ask, search intent and first-party conversations; volumes are estimates. https://www.airops.com/blog/announcing-prompt-discovery
[13] AirOps. Prompt Mining: Take action on the questions your buyers already ask you. 25 March 2026. First-party buyer language; no single dataset captures the full picture. https://www.airops.com/blog/announcing-prompt-mining
[14] Gumshoe. How Gumshoe Works: Methodology, Data Integrity, and Why It Matters. Updated April 2026. API-only, persona-first; non-deterministic outputs aggregated across re-runs; default overall visibility ±5 percentage points at 95 percent confidence. https://gumshoe.ai/resources/gumshoe-methodology/
[15] Samanyou Garg / Writesonic. Do AI Engines Cite the Same Sources? We Studied 161,286 Prompts Across 4 Platforms. 22 July 2026. 161,286 prompts; core four-way 70,879; domain Jaccard 0.119–0.237; max Perplexity × Google AI Overviews 0.237. https://writesonic.com/blog/ai-citation-source-overlap-study
[16] Ronald Sielinski. Quantifying Uncertainty in AI Visibility: A Statistical Framework for Generative Search Measurement. arXiv:2603.08924, 2026. Repeated sampling, bootstrap confidence intervals and citation-rank instability. https://arxiv.org/abs/2603.08924
[17] Ilan Strauss, Jangho Yang, Tim O'Reilly, Sruly Rosenblat, Isobel Moure. The Attribution Crisis in LLM Search Results: Estimating Ecosystem Exploitation. arXiv:2508.00838, 2025. n = 13,929 LMArena logs; attribution gap between pages accessed and pages credited. https://arxiv.org/abs/2508.00838
[18] Pranjal Aggarwal, Vishvak Murahari, Tanmay Rajpurohit, Ashwin Kalyan, Karthik Narasimhan, Ameet Deshpande. GEO: Generative Engine Optimization. arXiv:2311.09735, 2023. Visibility increases of up to 40 percent in already-retrieved top-5 context, not organic discoverability. https://arxiv.org/abs/2311.09735
[19] Olivier Martinez. Optimizing Visibility in Generative Engines: A Critical Survey of Generative Engine Optimization (2023–2026). arXiv:2607.14035, 2026. Reviews 45 studies; gains conditional on already-in-context content. https://arxiv.org/abs/2607.14035
[20] OtterlyAI. How OtterlyAI collects data. 17 July 2026. Public-UI aggregation; Claude API exception; daily prompts. https://help.otterly.ai/how-otterlyai-collects-data
[21] Trakkr. Research. Roughly 500 discovery questions, each sampled once; tracked prompts run against all eight models every day. https://trakkr.ai/learn/docs/features/research
[22] Orchly. How to track AI visibility in Orchly. Updated 13 June 2026. Visibility, citations, sentiment, competitor tracking; "geography and personalization included." https://orchly.ai/help/track-ai-visibility/
[23] Orchly. How to read AI traffic analytics and logs. Updated 13 June 2026. Orchly's taxonomy places Google-Extended under AI Chatbot. https://orchly.ai/help/read-ai-traffic-and-audit-logs/
[24] Google Crawling Infrastructure. Google's common crawlers — Google-Extended. Last updated 14 July 2026. Google-Extended is a robots.txt product token with no separate HTTP User-Agent. https://developers.google.com/crawling/docs/crawlers-fetchers/google-common-crawlers
[25] Google Search Central. Google Search's guidance on using third-party SEO tools, services, and advice. Updated 5 June 2026. Google does not evaluate them; no internal ranking data; no performance guarantee. https://developers.google.com/search/docs/fundamentals/third-party-seo
[26] OpenAI. Terms of Use. Effective 1 January 2026. Scope: services for individuals. Prohibits automatically or programmatically extracting data or Output. Does not, by itself, govern API or Enterprise. https://openai.com/policies/terms-of-use/
[27] Charles Goodhart. Problems of Monetary Management: The UK Experience. In Papers in Monetary Economics, Vol. I. Reserve Bank of Australia, 1975. (1984 Palgrave reprint is a later edition, not the origin year.)
[28] Donald T. Campbell. Assessing the impact of planned social change. Occasional Paper No. 8, Public Affairs Center, Dartmouth College, December 1976; Evaluation and Program Planning 1979, 2(1): 67–90. DOI: 10.1016/0149-7189(79)90048-x
[29] Jeffery Rodamar. There ought to be a law! Campbell versus Goodhart. Significance, 2018. DOI: 10.1111/j.1740-9713.2018.01205.x
[30] Peec AI. Metrics overview. Visibility as the percentage of AI responses where a brand appears; share of voice as brand mentions divided by all tracked-brand mentions. https://docs.peec.ai/metrics-overview
[32] John Mueller. A new resource for optimizing for generative AI in Google Search. Google Search Central Blog, 15 May 2026. Optimisation guide; not the 3 June Search Console reports announcement. https://developers.google.com/search/blog/2026/05/a-new-resource-for-optimizing