# The Price of Water
Why the world’s most valuable resource can still be the easiest thing to evaporate
Volume 75 · Edition 1 · 2026-10-20
Category: C · Infrastructure (https://www.thierry-gilgen-ict.ch/library/infrastructure)
Canonical: https://www.thierry-gilgen-ict.ch/field-notes/the-price-of-water
*In 2009, Nestlé’s chairman warned that we had failed to price water properly. Seventeen years later, the data-centre boom is testing whether we ever learned the lesson.*
## The water we never priced
In written answers published by McKinsey Quarterly in December 2009, Peter Brabeck-Letmathe, then chairman of Nestlé, was asked whether putting a price on water would improve its use. He began with an extraordinary judgement: water was, in his words, “by far the most valuable resource on this planet.” [^1]
His complaint was not that water had suddenly become rare everywhere. It was that the cost of providing it could be concealed inside subsidies, taxes, municipal infrastructure and investments already made. Water could be indispensable and still appear cheap to the next person opening a tap. [^1]
The speaker matters. Nestlé has faced longstanding criticism about its water business; Brabeck’s history of statements about water markets and rights is contested. He should not be introduced as an uncomplicated guardian of a common good. But the economic question he raised deserves examination on its merits.
He was speaking before today’s generative-AI boom, before fleets of accelerators became the physical backbone of products promising to transform human work. He was chiefly discussing agriculture and other water-intensive activity. Yet the diagnosis travels remarkably well.
In 2026, the same dilemma is visible behind the walls of an industry that describes itself in terms of software, intelligence and the cloud. Computers turn electricity into heat. That heat has to go somewhere. And at many sites, one effective way of moving it into the atmosphere is to evaporate water.
Sometimes that water has been treated to drinking-water standards.
Not because a computer needs to drink. Not because every alternative is feasible everywhere. But because the available cooling design, local pipes, water chemistry, energy prices, capital costs and speed of construction can make a potable supply attractive.
**The water bill tells us what the operator pays. It does not necessarily tell us what the decision costs everyone else.**
That is the question of this investigation: when we build the machinery of the digital future, who decides which water it may consume, and how is that decision justified?
## 1. What does it mean to “consume” water?
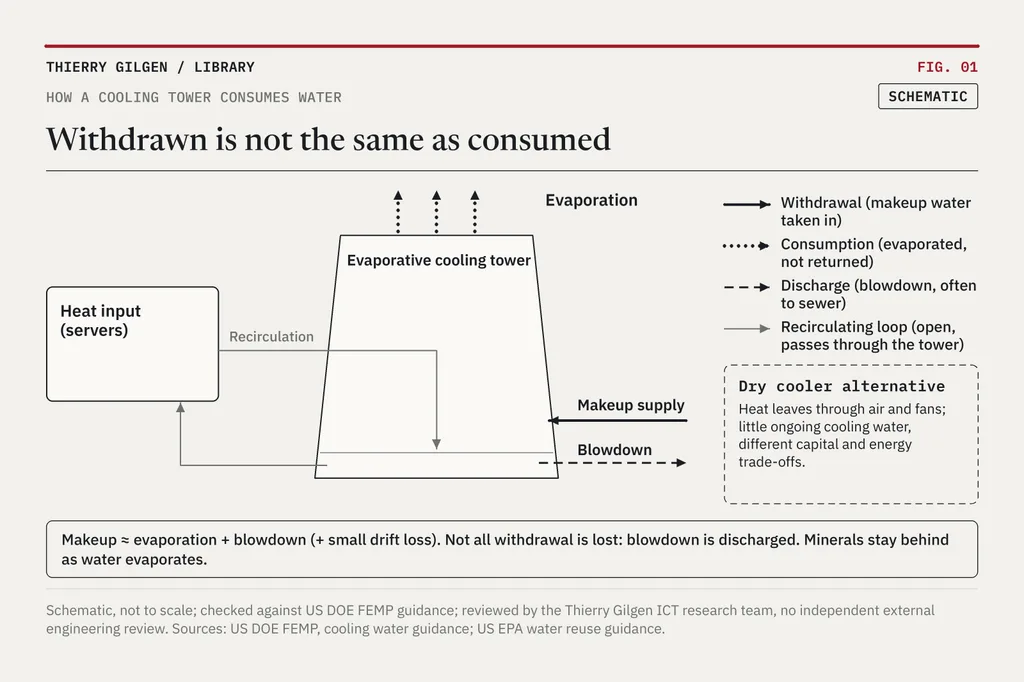
First, language matters. A data centre *withdraws* water when it takes water from a utility, river, aquifer or other source. It *consumes* water when that water is not returned to the same relevant system over the accounting period, for instance because it evaporates. Water discharged back into a sewage system may count as withdrawal but not as the same amount of consumption. Neither number alone describes local consequences: the season, the basin, the source and the discharge destination also matter.
At an evaporative cooling tower, a portion of recirculating water evaporates and takes heat with it. Minerals remain in the circulating water. Operators periodically release some concentrated water, the *blowdown*, and add makeup water. The US Department of Energy explains that improving cycles of concentration can lower makeup demand, but evaporation is fundamental to how the tower works. [^2]
Figure 1. Withdrawn is not the same as consumed.
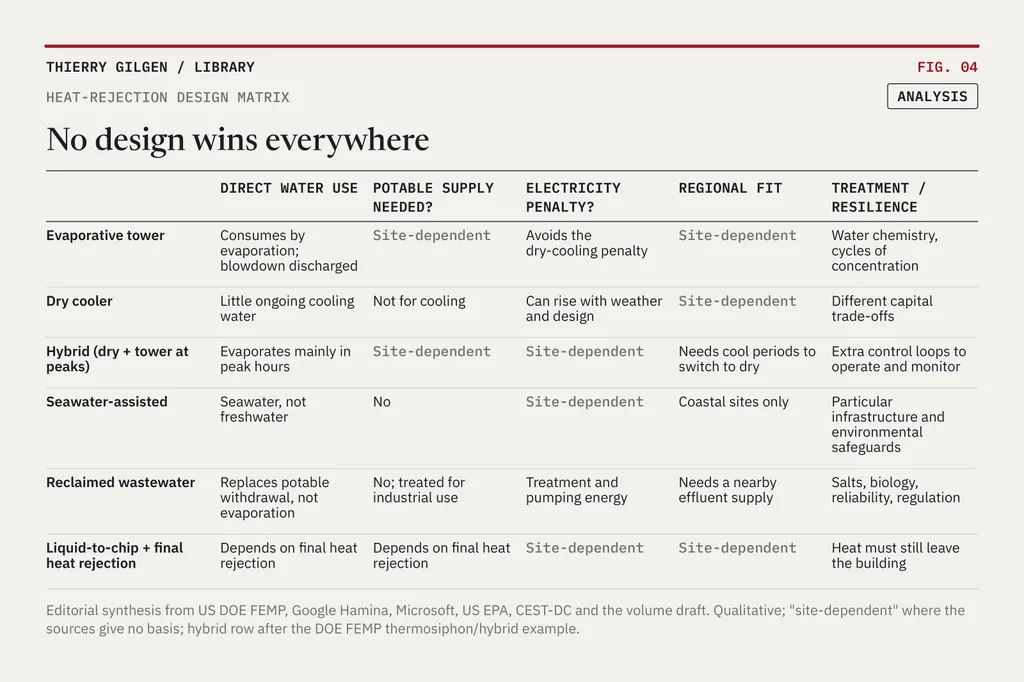
A sealed liquid loop is different. Liquid can carry heat from servers without being continuously discarded. But the heat must still leave the building. A closed loop feeding an evaporative tower can still consume substantial water; a closed loop rejecting heat through dry coolers may use little ongoing cooling water while demanding different capital and energy trade-offs.
The phrases “liquid cooled”, “closed loop” and “zero water for cooling” therefore describe different things. None should be treated as interchangeable.
A third distinction matters as much: *freshwater* is not necessarily *potable water*. Rivers, lakes and certain groundwater sources may supply freshwater without prior drinking-water treatment. Reclaimed wastewater is non-saline, but company accounting such as Google’s excludes it from “freshwater”, and it is not drinkable without further treatment. Seawater is an entirely different supply, suitable only with particular infrastructure and environmental safeguards.
A serious public debate needs all these distinctions. Otherwise a large withdrawal figure becomes a claim about drinking water; a company’s replenishment estimate becomes a claim that the local aquifer has recovered; and an efficient server becomes evidence of a sustainable site. None of those leaps follows automatically.
## 2. The apparently obvious choice
It would be convenient to assert that data centres use potable water simply because it is the cheapest. It would also be too simplistic.
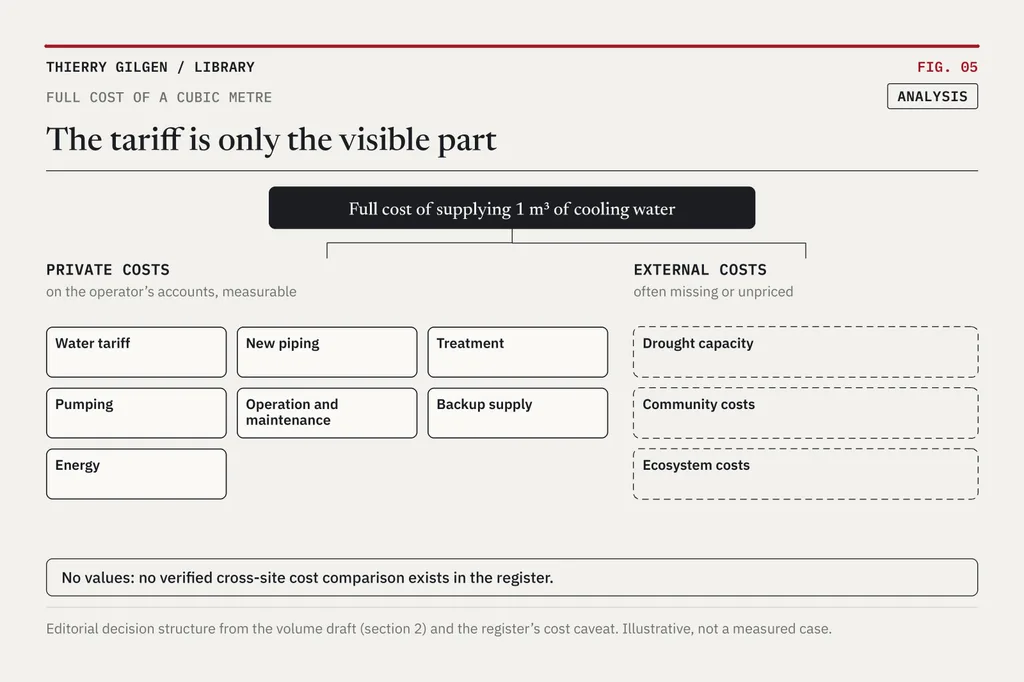
The relevant comparison is rarely the price of a cubic metre of tap water against a cubic metre of treated wastewater in isolation. It is the full cost of supplying **water of adequate quality, in sufficient volume, at the right moments, with adequate resilience**, over the life of the facility.
A utility connection may already exist. A reclaimed-water system may require a separate pipe, pumping capacity, treatment, storage, monitoring and an agreement with a wastewater utility. Salts, biological contamination and varying chemistry can raise corrosion, fouling and maintenance risks. Above all, any cooling tower, and especially one fed with reclaimed water, must control *Legionella*: bacteria that can spread in the tower’s aerosol and cause a serious lung infection. Dry cooling may avoid much of the water demand but cost more energy or cooling capacity under certain weather conditions. And delays matter when a data centre’s commercial value depends on how quickly capacity comes online.
There is nothing irrational about considering these constraints. The problem begins when the operator’s calculation ignores burdens that fall outside its accounts: competing community demand, future utility capacity, drought exposure, environmental flows, public subsidies and the opportunity cost of reserving scarce water for industrial use.
An existing publicly funded pipe is not necessarily a free resource, even if its historical construction cost no longer appears on the operator’s balance sheet.
Figure 2. The tariff is only the visible part.
The economic proposition is therefore narrower, and stronger, than “drinking water is always cheaper”: **the current configuration of prices and infrastructure may reward an operator for choosing a supply whose full social and environmental cost is not reflected in its bill.**
This is a hypothesis to test facility by facility, not a proven explanation of any named company’s motives. Published, comparable supply contracts and feasibility assessments remain essential to demonstrate a specific cost-driven choice.
## 3. The water is real, even when the cloud is not
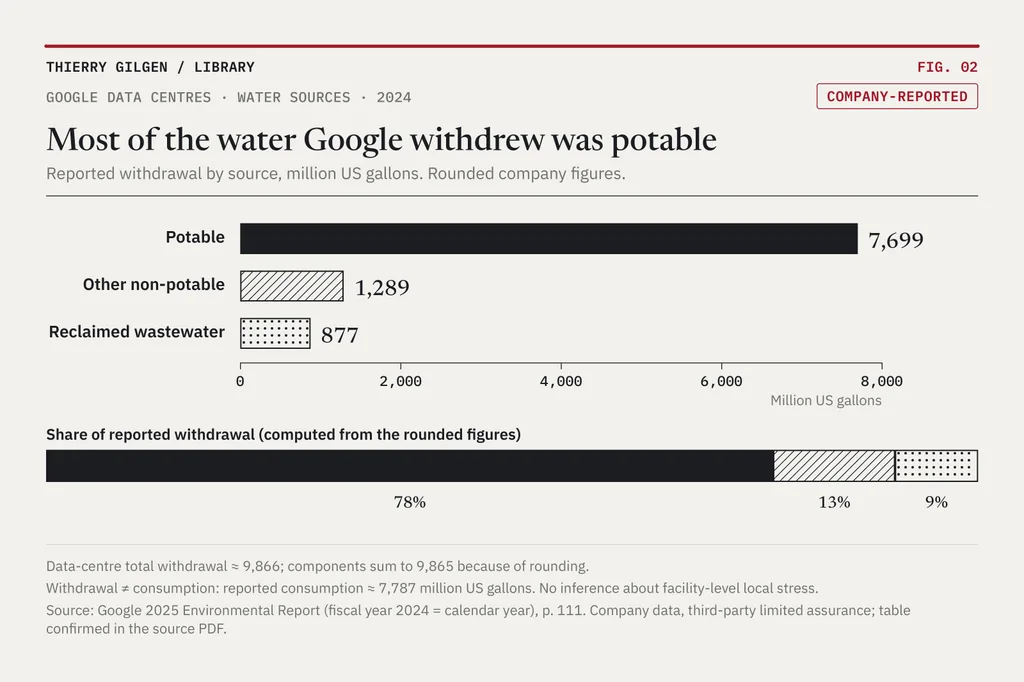
Google’s 2025 Environmental Report provides unusually concrete evidence of water sources. These are corporate data, reported by the company; Google says the table is subject to third-party limited assurance. For calendar 2024, its reported data-centre water withdrawal totalled approximately **9,866 million US gallons**. Of that, approximately **7,699 million gallons** were classified as potable, **1,289 million** as other non-potable water, and **877 million** as reclaimed wastewater. The rounded components do not need to sum exactly to the total. Data-centre water *consumption* was reported separately, at approximately **7,787 million US gallons**. These are different measures. [^3]
Figure 3. Most of the water Google withdrew was potable.
On these disclosures, potable supply represented approximately 78% of reported withdrawal in 2024. That figure is striking. It is not a global industry average, not proof of direct household deprivation at each location, and not an inference that Google acted because water was cheap. It is evidence that potable water remains a substantial source of supply even for a technologically sophisticated operator. Google also says that 87% of its 2025 freshwater withdrawal came from sources at low or medium risk of depletion or scarcity, by its own classification. [^4]
Google’s 2026 Environmental Report says water-stewardship projects replenished about 7.7 billion gallons in 2025, roughly 78% of the company’s total freshwater consumption that year (a different 78% from the 2024 potable share above), not only that of its data centres. Such programmes can have value. But restoring water through a project, potentially in another location or season, is not automatically equivalent to leaving a specific stressed local supply untouched. Replenishment should be evaluated for geography, timing, additionality and verification, not confused with zero consumption. [^5]
Amazon, meanwhile, reported a fleet-level 2025 water-usage effectiveness of **0.12 litres per kilowatt-hour**, crediting operational and cooling decisions. It is a useful efficiency indicator within its stated accounting boundary, not a universal comparison of corporate water impacts. [^6]
The industry is not a monolith. Cooling architecture, site geography, workload, load factor, electricity sources and reporting boundaries differ. Nuoa Lei and colleagues’ 2025 peer-reviewed assessment found variations exceeding **10,000-fold** in modelled water consumption per workload under differing conditions. That figure is about the diversity of systems and assumptions, not a measurement showing that one particular user prompt consumes 10,000 times more than another. [^7]
This is why neat claims that “one AI question uses X glasses of water” so often mislead. They usually hide assumptions about model, hardware, electricity, climate, cooling and location. The defensible metric depends on the question we are actually asking.
## 4. A map is not a water meter
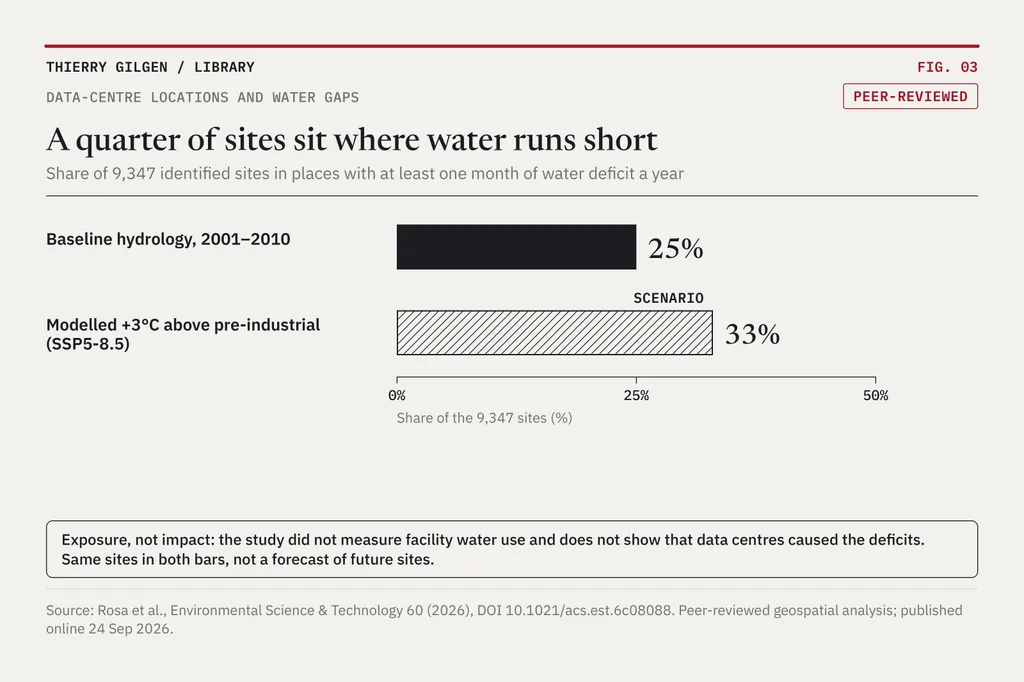
In September 2026, Lorenzo Rosa and colleagues published a study of **9,347 identified data-centre locations** worldwide. Their geospatial analysis found that **25%** fell in places experiencing at least one month of water deficit annually under baseline hydrological conditions for 2001–2010. Under a modelled warming of **+3°C above pre-industrial levels**, derived from a high-emissions pathway, the share rose to **33%** for those same identified sites. [^8]
Figure 4. A quarter of sites sit where water runs short.
The finding matters. So does its limitation: the study did **not** measure how much water each data centre consumed, and it did not establish that the facilities created the local deficit. It identified exposure and potential overlap with other water users. Its own authors explicitly say that translating such overlap into measurable local impacts remains an open question.
It is tempting to use a global stress map as proof that data centres are drying out towns. We should resist. Water harm is local, temporal and relational. A thirsty facility in a water-abundant basin can have different consequences from a moderately water-consuming facility at the edge of a stressed municipal network.
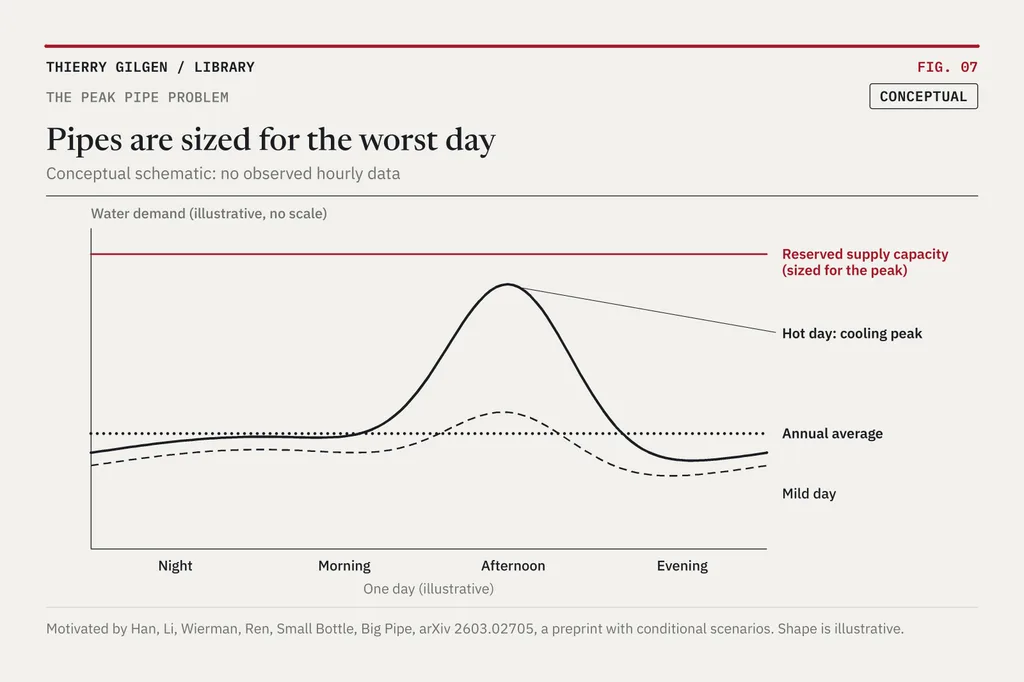
What needs scrutiny is not just the annual total. It is *peak demand*. Cooling water may be needed most urgently on the hottest days, precisely when municipal supply, agriculture and electricity systems are under their own greatest pressure.
A 2026 analysis, *Small Bottle, Big Pipe*, frames this as a public-water-system capacity problem: communities may need to provide enough pipe and treatment capacity for exceptional peaks even when average withdrawals appear manageable. Its forward-looking US figures are scenario estimates, not observed 2030 outcomes, and the analysis is still a preprint; nevertheless the capacity question is critical. [^9]
Figure 5. Pipes are sized for the worst day.
A permit should ask not only “How many litres in a year?” but “How many cubic metres on the worst day, from which source, at whose expense, under what drought conditions?”
## 5. Proof that the alternatives are real
The false choice is between accepting potable-water evaporation and giving up computing altogether. There are already several credible alternatives. They are not universally interchangeable, but they make the requirement for site-specific justification reasonable.
**Hamina, Finland: seawater and useful heat.** Google’s facility in Hamina uses seawater from the Gulf of Finland for its cooling design. The company also runs an offsite heat-recovery project with the city-owned utility Haminan Energia. When it was announced, Google said the recovered heat would represent about 80% of the local district-heating network’s annual demand, according to the utility. That is a project estimate, not evidence that every bit of server heat is already recovered. Coastal geography and discharge protections make Hamina distinctive, not a template for landlocked deserts. [^10]
{/* P01 SLOT photo (licensed, see photos/PHOTO-SHORTLIST.md): seawater or district-heat context, not a fabricated facility image. */}
**Next-generation closed-loop cooling: less evaporation.** In December 2024, Microsoft introduced designs using chip-level liquid cooling with no water evaporation for cooling. The company said each data centre using this approach would avoid the need for more than 125 million litres of water a year. That is a company estimate for a design, not verified universal savings for the entire fleet, and water is still used on site for other purposes. Its significance is technological: the water-heavy default is not mandatory for all new computing architectures. [^11]
**Reclaimed wastewater: a different pipe.** Treated municipal or industrial effluent can supply cooling systems when treatment, water chemistry, reliability and regulations permit. It may replace potable withdrawals, but the water must still be made suitable for its industrial purpose. The correct comparison includes both pipes, treatment, pumps, discharge constraints and the energy needed to run them. [^12]
{/* P02 SLOT photo (licensed): reclaimed-water or wastewater treatment plant. */}
These cases do not eliminate trade-offs. Seawater brings ecological and corrosion concerns. Dry rejection can bring energy penalties. Wastewater needs adequate treatment and dependable flows. Heat recovery depends on geography, temperatures and demand. Responsible engineering is not about discovering a universally perfect coolant. It is about requiring that alternatives be evaluated honestly.
Figure 6. No design wins everywhere.
## 6. When saving water uses more electricity
The problem becomes harder when we include indirect water use.
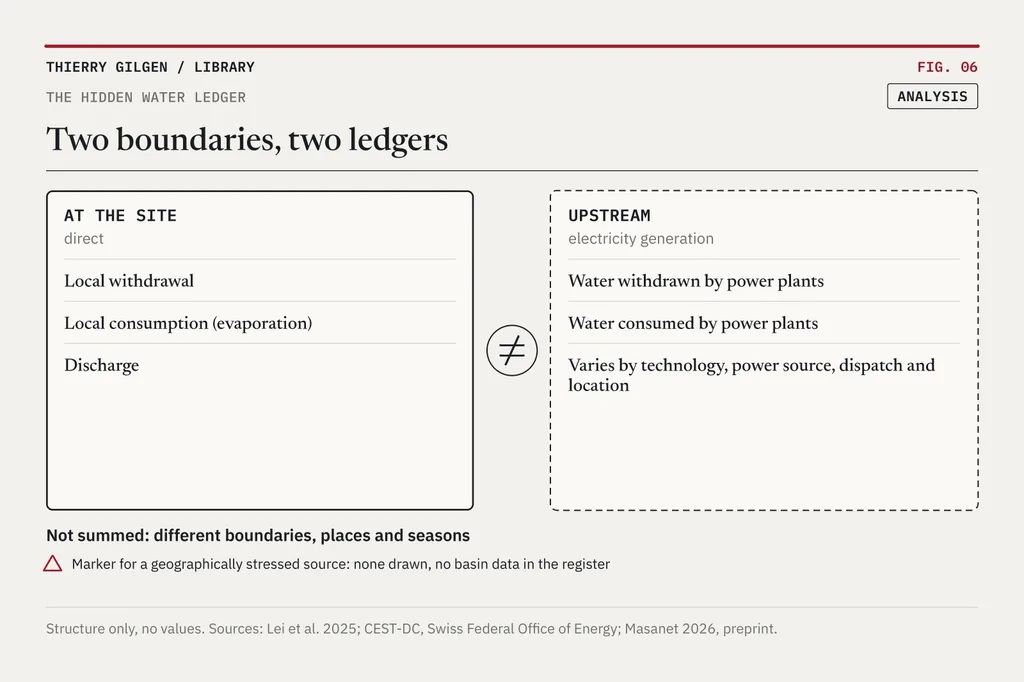
Evaporation is an effective way to remove heat. Avoiding it can increase electricity required for fans, mechanical refrigeration or other heat-rejection equipment, depending on weather and system design. Electricity generation may itself withdraw and consume water. Its impacts vary dramatically by technology, power source, dispatch and location.
For that reason, even a cooling choice that reduces the water meter at a data centre could shift part of the water footprint upstream. Conversely, electricity from low-water technologies can make dry cooling more compelling. Researchers supported by the Swiss Federal Office of Energy have examined precisely this relationship between on-site cooling and water associated with electricity supply. [^13] Google, for its part, says that in many places water cooling can reduce a data centre’s energy use by about 10% compared with air cooling; that is the company’s own claim. [^14]
Figure 7. Two boundaries, two ledgers.
The appropriate question is not “Which design uses the fewest litres at the fence?” but “Which design creates the least unacceptable water and environmental burden to deliver an equivalent service, at this location and time?”
We should also resist a reverse simplification: more efficient electricity use does not automatically justify evaporating scarce local water. A litre in a drought-stricken basin is not interchangeable with a litre in a distant, water-abundant watershed. Accounting should disclose each impact before combining them into any decision model.
## 7. Who owns the capacity of a pipe?
Imagine a town preparing for a growing population, ageing infrastructure and hotter summers. A large operator proposes a data centre. It offers jobs, contracts, tax receipts and strategic connectivity. It requests a water connection large enough to accommodate occasional cooling peaks.
Even if its average yearly bill seems modest, the town may need to reserve treatment capacity, storage, pumping and emergency headroom. If water becomes scarce, which use will be curtailed first? Who pays for expansion? Who bears the risk if projections are wrong? Can residents examine the supply contract? Will the operator’s cooling system change before the next drought?
{/* P03 SLOT photo (licensed): municipal water infrastructure, pipe or water tower. */}
These are governance questions, not expressions of hostility towards technology.
Policy is beginning to respond. On 21 September 2026 the European Commission adopted a delegated regulation that would set up an EU rating scheme for data centres above 500 kW, with labels based partly on water usage effectiveness. At our research cutoff it was still under scrutiny by the European Parliament and the Council and not yet in force. Better measurement is valuable, but a label alone does not establish acceptable local impacts or a hierarchy of water uses. [^15]
Shareholders are also demanding more transparent site-level disclosure. Reuters reported in April 2026 that investors were pressing large cloud companies on water and electricity use in US data centres. The issue is moving from community protest into corporate risk governance. [^16]
Where local water use is controversial, both parties deserve scrutiny. Operators may overstate the inevitability of their design or the meaning of replenishment. Critics may equate all withdrawals with consumption or compare annual volumes while ignoring energy trade-offs. Neither contributes to decisions capable of surviving serious examination.
## 8. A better test for the next data centre
The most useful outcome is not a categorical ban on using potable water for cooling. It is an enforceable obligation to demonstrate why a proposed water strategy is justified.
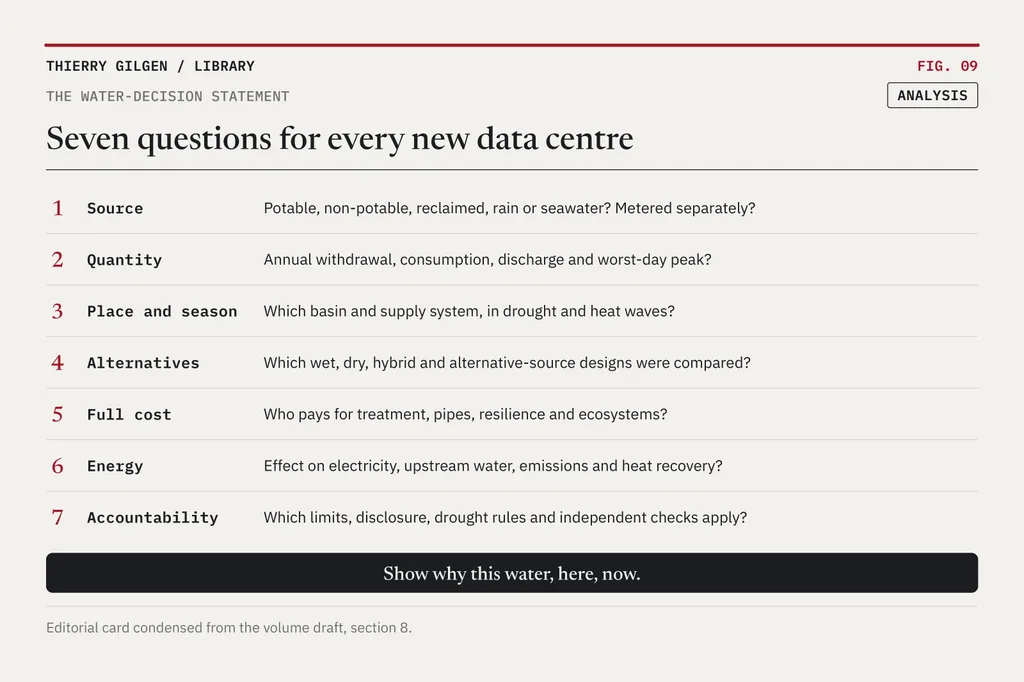
Every material proposal should publish **a water-decision statement** that can be scrutinised by engineers, utilities and affected communities. At minimum it should answer:
1. **Source.** What share will come from potable water, non-potable freshwater, reclaimed wastewater, rainwater or seawater? Are volumes metered separately?
2. **Quantity.** What are expected annual withdrawal, annual consumption, discharge and worst-day peak withdrawal? What are the uncertainty ranges?
3. **Place and season.** Which basin and supply system will bear the demand, and how does the risk change during drought and heatwaves?
4. **Alternatives.** Which wet, dry, hybrid and alternative-source designs were evaluated on comparable workload, resilience and lifetime assumptions?
5. **Full cost.** Who pays for treatment, pipes, upgrades, resilience, water rights and ecosystem protections? What future costs might be passed to ratepayers?
6. **Energy.** How does each option affect total electricity use, upstream water, emissions and useful heat recovery?
7. **Accountability.** What operational water limits, disclosure intervals, drought curtailment rules, independent checks and revision triggers apply?
Figure 8. Seven questions for every new data centre.
Where potable water is selected despite materially lower-scarcity alternatives, the operator should explain the reasons in terms that can be tested. Where an alternative is demonstrably worse overall or technically unreliable, that should be documented too.
A price signal can help. But water is not merely another commodity whose allocation becomes automatically just when every bidder pays more. Ability to pay is not the same as priority of use. A framework that protects essential human needs and ecological flows must accompany whatever economic instruments are chosen.
## 9. What Brabeck saw, and what he did not
Back in 2009, the chairman of Nestlé argued that water was extraordinarily valuable and that its economic treatment hid its real costs. His words were controversial for reasons we should not ignore: debates about water pricing, privatisation and the human right to water are genuinely difficult. [^1]
Yet the data-centre question reveals why the old argument is worth reopening. If the resource is essential, making the price reflect part of its scarcity is sensible, but may not be enough. A company that can comfortably outbid a neighbourhood does not thereby establish that its proposed use serves the public interest.
The future of computing will not be weightless. It will occupy land, consume electricity, generate heat and interact with water systems built for other purposes. That fact is not a reason to reject computing. It is a reason to govern its physical consequences with the same seriousness we devote to its intellectual possibilities.
Seventeen years after that interview, the new question is not whether water is valuable. We already know it is.
**The question is whether the next data centre will have to prove it understands the value of the water it asks to use.**
## Method and limitations
Research cutoff: 20 October 2026. This article is a sourced editorial synthesis, not a facility-level engineering audit or global water-footprint inventory. It draws on a contemporaneous historical interview; peer-reviewed research on data-centre water variation and water-stress exposure; US Department of Energy engineering guidance; company environmental disclosures and infrastructure case studies; and policy and investor reporting. Operator statements are labelled as such. Water withdrawal, water consumption, potable supply, freshwater, reclaimed wastewater and replenishment are deliberately distinguished. A new methodological preprint by Eric Masanet shows how strongly estimates depend on the method chosen. [^17]
The 2026 global study measures *geographic exposure to water gaps*, not data-centre-caused scarcity. Cooling systems are site-dependent. The economic hypothesis requires project-specific tariff, capital-cost, operating-cost, energy and alternative-supply data before applying it to any particular operator. The public-water-system capacity analysis cited here is a preprint and its projections are conditional. No facility is alleged to have selected potable water to maximise profit without documentary evidence. No documented, comparable potable-versus-reclaimed supply decision was available for this essay, and the figures and technical claims were reviewed by the Thierry Gilgen ICT research team, with no independent external engineering review.
### Status of the key claims
| Claim | Status | Source |
|---|---|---|
| Brabeck: water is “by far the most valuable resource on this planet” | CONFIRMED (verbatim, 2009 interview) | [^1] |
| Google data centres, 2024: 9,866 million US gallons withdrawn, 7,699 potable, 1,289 non-potable, 877 reclaimed, 7,787 consumed | REPORTED (corporate data, limited assurance) | [^3] |
| Potable share of Google’s reported withdrawal: about 78% | ANALYSIS (7,699 ÷ 9,866) | [^3] |
| Google replenished about 7.7 billion gallons in 2025, about 78% of company-wide freshwater consumption | INSTITUTIONAL CLAIM (corporate accounting) | [^5] |
| Amazon water-usage effectiveness 2025: 0.12 litres per kilowatt-hour | INSTITUTIONAL CLAIM (corporate data) | [^6] |
| Workload-level water use varies more than 10,000-fold | CONFIRMED (peer-reviewed, modelled) | [^7] |
| 25% of 9,347 identified sites in water-gap areas (2001–2010); 33% at +3°C | CONFIRMED (peer-reviewed, exposure only) | [^8] |
| Peak capacity burden on public water systems | REPORTED (preprint, scenarios) | [^9] |
| Hamina heat recovery about 80% of district-heat demand | INSTITUTIONAL CLAIM (project estimate) | [^10] |
| Microsoft design avoids more than 125 million litres a year per data centre | INSTITUTIONAL CLAIM (design estimate) | [^11] |
| Potable water is chosen because it is cheapest for operators | UNKNOWN (hypothesis; no comparable supply contracts available) | none |
## Sources
[^1]: McKinsey Quarterly, “Water as a scarce resource: An interview with Nestlé’s chairman”, 1 December 2009 (written answers given in October 2009). [Water as a scarce resource](https://www.mckinsey.com/capabilities/sustainability/our-insights/water-as-a-scarce-resource-an-interview-with-nestl-and-233s-chairman). Interviewee opinion, not independent economics. Quoted phrase verbatim; the source sentence continues “is treated as if did not have any value at all”.
[^2]: US Department of Energy, Federal Energy Management Program. [Cooling Water Efficiency Opportunities for Federal Data Centers](https://www.energy.gov/cmei/femp/cooling-water-efficiency-opportunities-federal-data-centers). Engineering guidance on evaporation, blowdown, makeup water and cycles of concentration; not facility data.
[^3]: Google, 2025 Environmental Report (fiscal year 2024), June 2025, data tables pp. 110–111, “Data centers total”. [Google 2025 Environmental Report](https://sustainability.google/reports/google-2025-environmental-report/). Corporate data, subject to third-party limited assurance; rounded. Withdrawal 9,866, discharge 2,079, consumption 7,787 million US gallons.
[^4]: Google Data Centers. [Operating sustainably](https://www.datacenters.google/operating-sustainably/). Company statement: 87% of 2025 freshwater withdrawal from sources at low or medium risk of depletion or scarcity; risk definition is Google’s.
[^5]: Google, 2026 Environmental Report (fiscal year 2025). [Google 2026 Environmental Report](https://sustainability.google/google-2026-environmental-report/). Company accounting: about 7.7 billion gallons replenished, roughly 78% of total company freshwater consumption; not local physical replacement.
[^6]: Amazon (Alex Davies), 11 June 2026. [Amazon’s data centers are 7x more water-efficient than the industry average](https://www.aboutamazon.com/news/sustainability/amazon-data-center-water-usage). Corporate data: 0.12 L/kWh for 2025; boundaries not aligned with other companies.
[^7]: Nuoa Lei, Jun Lu, Arman Shehabi, Eric Masanet, “The water use of data center workloads: A review and assessment of key determinants”, *Resources, Conservation and Recycling* 219 (2025) 108310. [doi:10.1016/j.resconrec.2025.108310](https://doi.org/10.1016/j.resconrec.2025.108310). Peer reviewed; modelled workload-level variation, not a per-prompt measurement.
[^8]: Lorenzo Rosa et al., “One Quarter of Global Data Centers are Located in Water-Stressed Areas”, *Environmental Science & Technology* 60 (2026), published online 24 September 2026. [doi:10.1021/acs.est.6c08088](https://pubs.acs.org/doi/10.1021/acs.est.6c08088). Peer reviewed; exposure of identified locations, not facility water use or attributable impact. +3°C relative to pre-industrial, SSP5-8.5 projections.
[^9]: Yuelin Han, Pengfei Li, Adam Wierman, Shaolei Ren, “Small Bottle, Big Pipe: Quantifying and Addressing the Impact of Data Centers on Public Water Systems”, arXiv:2603.02705, v1 3 March 2026, v2 18 March 2026. [arXiv:2603.02705](https://arxiv.org/abs/2603.02705). Preprint, not peer reviewed; conditional scenarios.
[^10]: Google. [Hamina, Finland](https://datacenters.google/locations/hamina-finland/); [Our first offsite heat recovery project lands in Finland](https://blog.google/company-news/inside-google/around-the-globe/google-europe/our-first-offsite-heat-recovery-project-lands-in-finland/), May 2024; [Google’s AI commitment to Finland](https://blog.google/innovation-and-ai/infrastructure-and-cloud/global-network/google-ai-commitment-to-finland/), 9 September 2026. Company descriptions; the 80% figure is Haminan Energia’s estimate as cited by Google, not audited performance.
[^11]: Microsoft Cloud Blog, 9 December 2024. [Sustainable by design: Next-generation datacenters consume zero water for cooling](https://www.microsoft.com/en-us/microsoft-cloud/blog/2024/12/09/sustainable-by-design-next-generation-datacenters-consume-zero-water-for-cooling/). Company estimate: more than 125 million litres a year per data centre; zero water evaporated for cooling, not zero site water.
[^12]: US Environmental Protection Agency. [Water Reuse for Industrial Applications: Resources](https://www.epa.gov/waterreuse/water-reuse-industrial-applications-resources). Official reuse guidance, including data-centre cooling and the CDC’s “Controlling Legionella in Cooling Towers”; feasibility is site-specific.
[^13]: Roegen Centre for Sustainability, CEST-DC: Circular Economy Synergies and Trade-offs in Data Centres, supported by the Swiss Federal Office of Energy, May 2025 – April 2026. [CEST-DC](https://www.roegen.ch/projects/cest-dc-sfoe/). Project summary; full report not reviewed for quantitative claims.
[^14]: Alphabet, additional proxy soliciting material (DEFA14A) filed with the SEC, 3 June 2026. [Google water-stewardship statement](https://www.sec.gov/Archives/edgar/data/1652044/000119312526258001/d36803ddefa14a.htm). Company assertion: water cooling can reduce energy use by about 10% compared with air cooling in many places.
[^15]: European Commission, Delegated Regulation C(2026) 3472 final of 21 September 2026 establishing a common Union rating scheme for data centres. [C(2026) 3472 on EUR-Lex](https://eur-lex.europa.eu/legal-content/EN/TXT/?uri=intcom%3AC%282026%293472); [Commission news, 21 September 2026](https://commission.europa.eu/news-and-media/news/making-data-centres-energy-efficient-thanks-new-eu-rating-system-2026-09-21_en). Checked 20 October 2026: under two-month scrutiny by Parliament and Council, not yet published in the Official Journal or in force.
[^16]: Simon Jessop, Valerie Volcovici, Supantha Mukherjee, Reuters, 6 April 2026. [Investors press Amazon, Microsoft and Google on water, power use in US data centers](https://www.reuters.com/sustainability/boards-policy-regulation/investors-press-amazon-microsoft-google-water-power-use-us-data-centers-2026-04-06/). Independent reporting.
[^17]: Eric Masanet, “Estimating data center water use: Best practices and critical questions”, arXiv:2610.04735, 3 October 2026. [arXiv:2610.04735](https://arxiv.org/abs/2610.04735). Preprint, not peer reviewed.
## Connected reading
- [The AI Factory Is the New Factory Floor](https://www.thierry-gilgen-ict.ch/field-notes/the-ai-factory-is-the-new-factory-floor)
- [When the Water Tower Runs Low](https://www.thierry-gilgen-ict.ch/field-notes/when-the-water-tower-runs-low)
- [Who Owns the Warmth](https://www.thierry-gilgen-ict.ch/field-notes/who-owns-the-warmth)